Symphon-E App Production and Consumption Meter
1. Introduction
Dear customer,
Thank you for choosing the "Symphon-E App Production and Consumption Meter". You are welcome to send us your suggestions so that we can further improve the quality of our products.
2. Voraussetzungen und Kompatibilität
To use the "Symphon-E App Production and Consumption Meter", a EMS-supported meter is required.
Devices from the following manufacturers are currently supported:
Eastron (→ zur Konfigurationsanleitung) |
|
3. Installing the app
When you ordered the "Symphon-E App Production and Consumption Meter", you received a 16-digit license key. You can use this license key to redeem the app independently in the EMS App Center.
Instructions on how to proceed can be found here.
4. Symphon-E App Production and Consumption Meter
The integration of electrical generators, consumer loads, PV inverters and the grid connection meter via an additional meter allows those components to be integrated into energy management and Online Monitoring.
You can use the "Symphon-E App Production and Consumption Meter" to integrate a meter as a production and consumption meter.
As soon as the app has been activated on your system, you will see different widgets in your monitoring depending on how the meter is used:
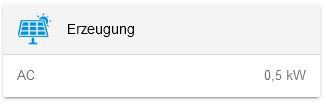
4.1. Use as an electricity generation meter
If the meter was integrated to record an AC generator (e. g. PV inverter), you will see the following widget:
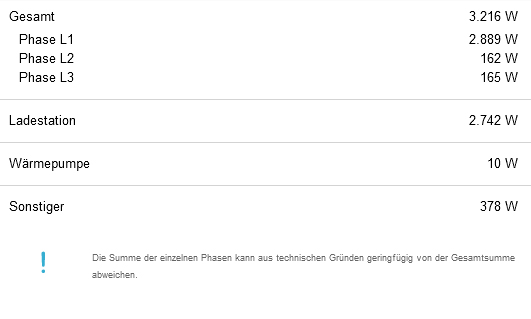
Click on the widget to open the detailed view of the app:
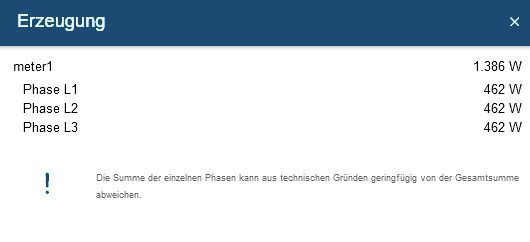
The power per phase is also displayed here.
| The sum of the individual phases may differ slightly from the total sum for technical reasons. |
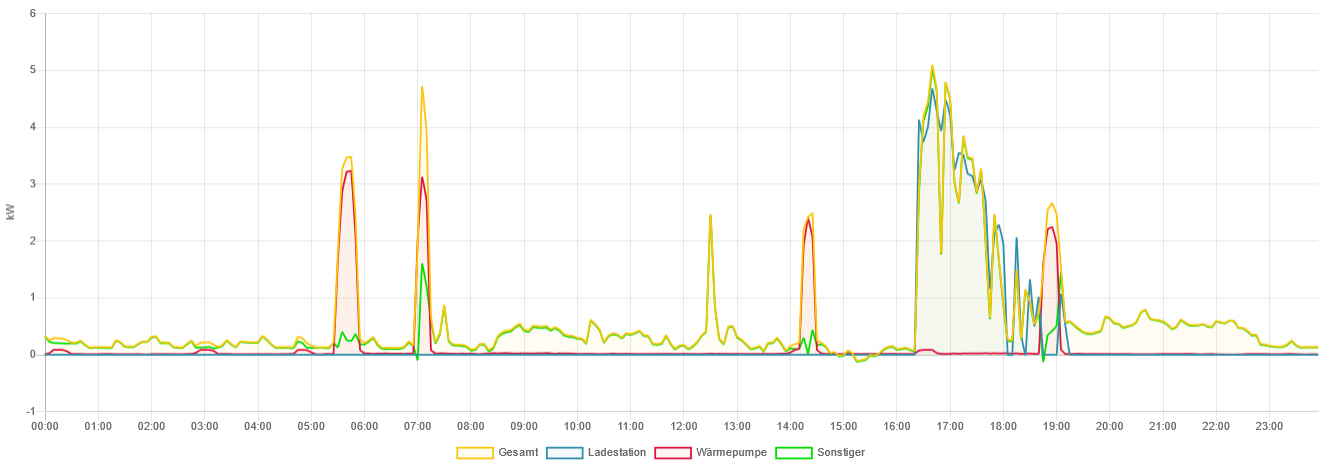
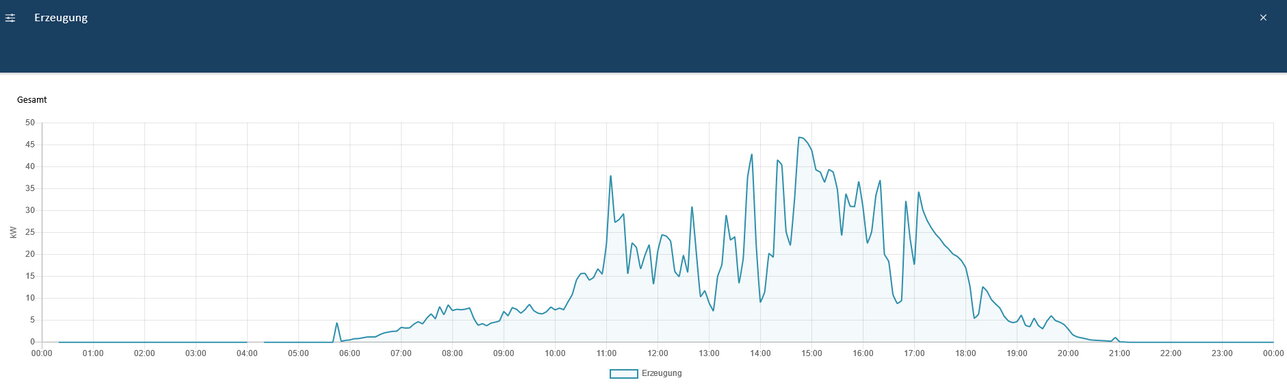
You can view the generation over time via the "History" tab in Online Monitoring:
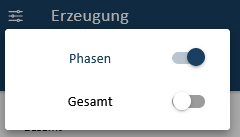
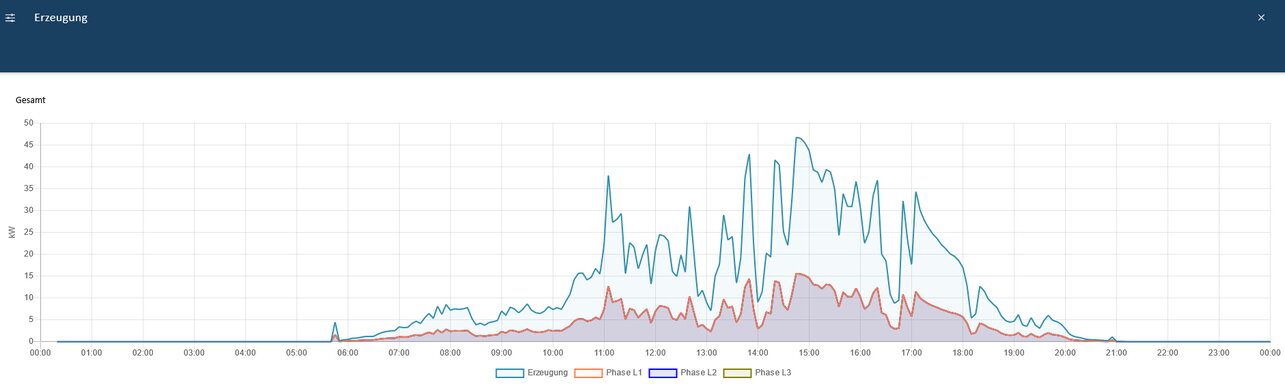
You can use the button at the top left to activate the view of generation per phase:
The generator is then displayed over time per phase
4.2. Use as a consumption meter
When used as a consumption meter, you will see the following widget:
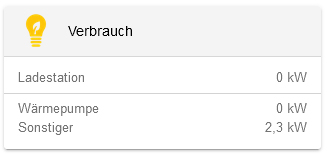
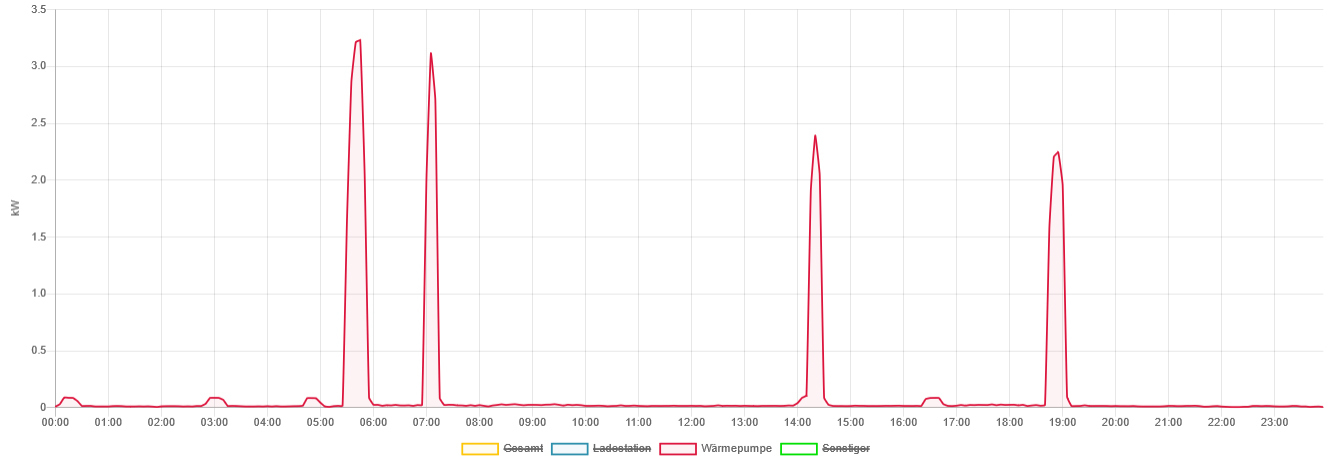
In the example above, a meter was used as a consumption meter for the heat pump.
Click on the widget to open the detailed view of the app:
| In contrast to the charging station and heat pump, total consumption is calculated and not measured directly. |
You can view the respective consumption of the device over time via the "History" tab in Online Monitoring: