Heckert Solar App — Monitoring
Here you can learn about the monitoring features offered by the Heckert Solar App and how to use them. Both the desktop and mobile views are shown.
EMS Cockpit
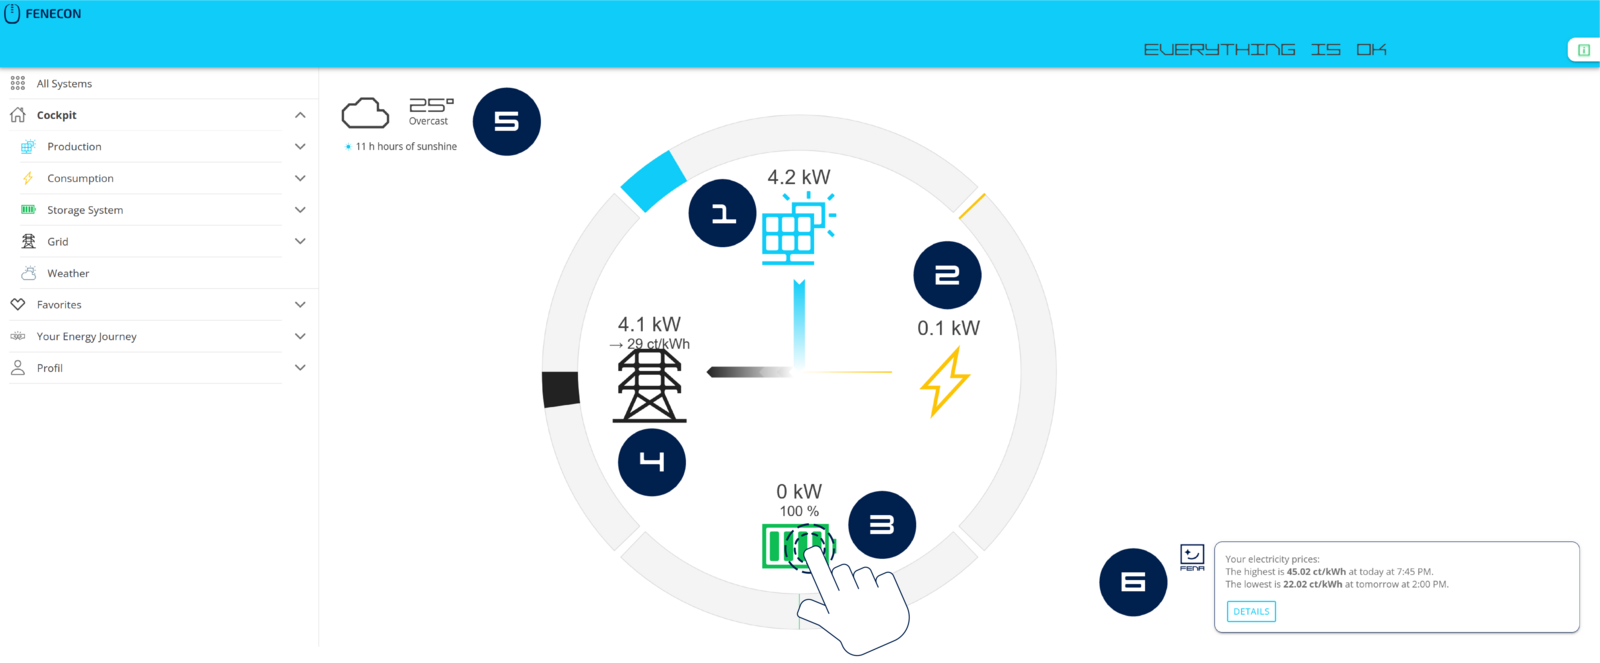
The EMS Cockpit is the central user interface for EMS. Here, you can view all relevant information about your system:
-
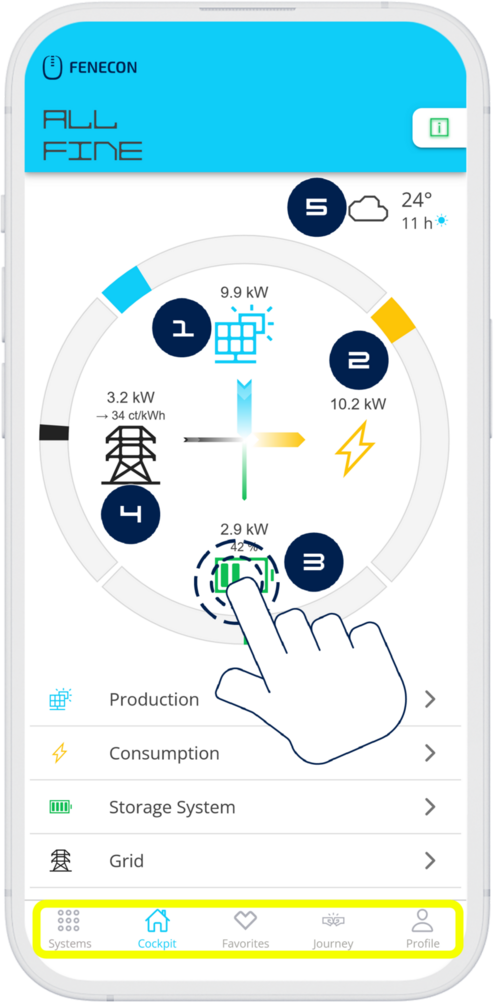
Zentrales Element ist der Leistungsmonitor. Er zeigt die aktuelle Produktion, den Verbrauch, die Be- und Entladung der Batterie sowie den derzeitigen Netzbezug oder die Netzeinspeisung.
-
The gray bars represent the maximum possible power of the various elements, which is generated automatically.
-
The consumption is calculated.
-
If one of the elements (except consumption) does not exist in the system, it is hidden.
Clicking or tapping on the respective icons will take you to the corresponding subpages of your system’s standard main menu items:
Selbstverständlich können Sie auch die das Hauptmenü links verwenden, um zu den gewünschten Seiten zu navigieren.
1. Production
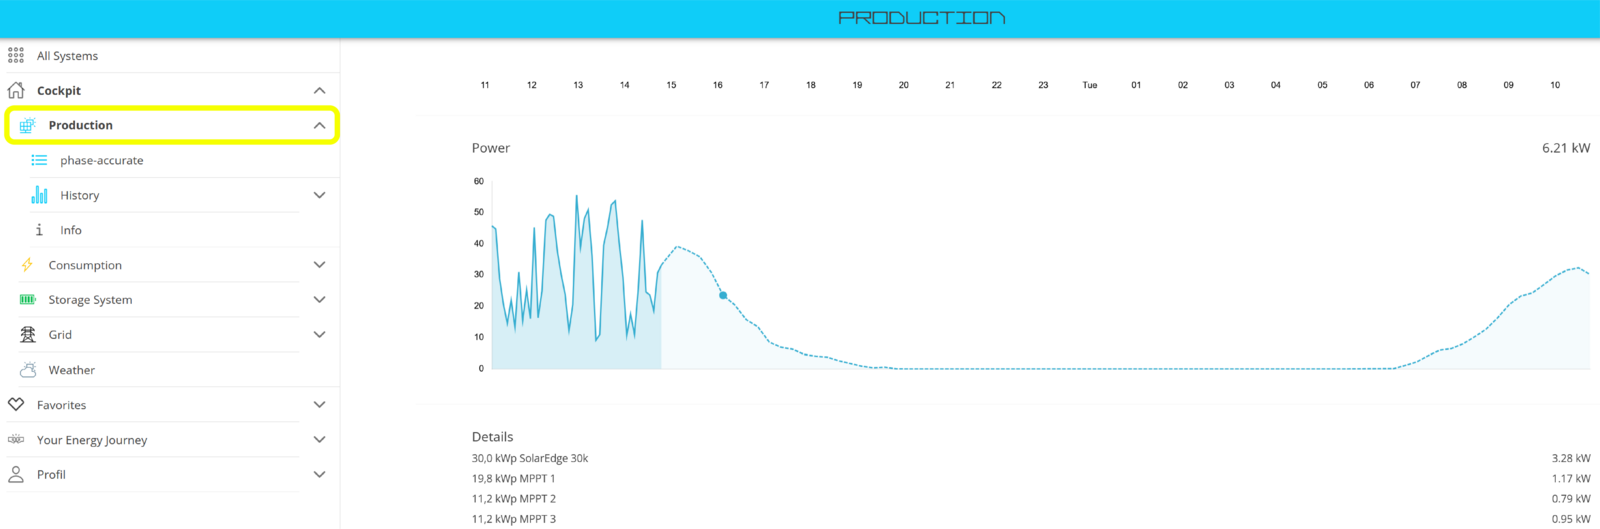
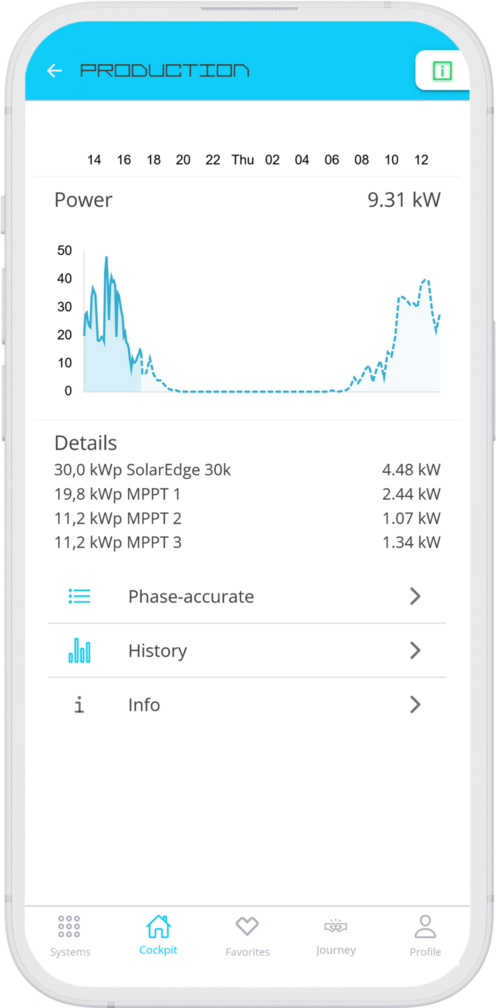
Der Hauptmenüpunkt ⬤ Erzeugung zeigt in seinem Hauptfenster die aktuelle Leistung Ihrer Erzeuger, z. B. der PV-Anlage, an. Sie erhalten außerdem eine Erzeugungsprognose für den aktuellen und den kommenden Tag in kWh angezeigt, sowie im unteren Bereich Details über Ihre eingebundenen Erzeuger.
The production forecast, shown as a dashed line in the graph, becomes visible after installing the free Symphon-E App Weather.
Other submenu items include:
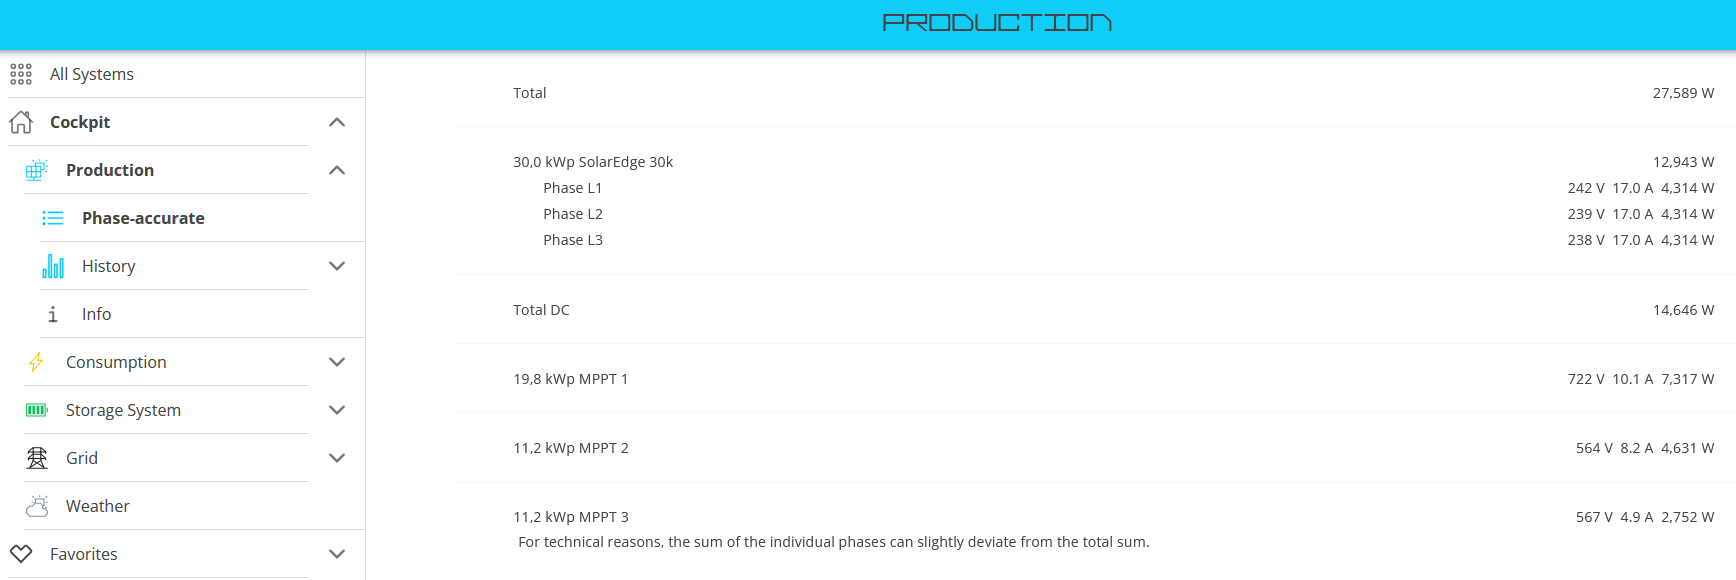
Phase-accurate production:
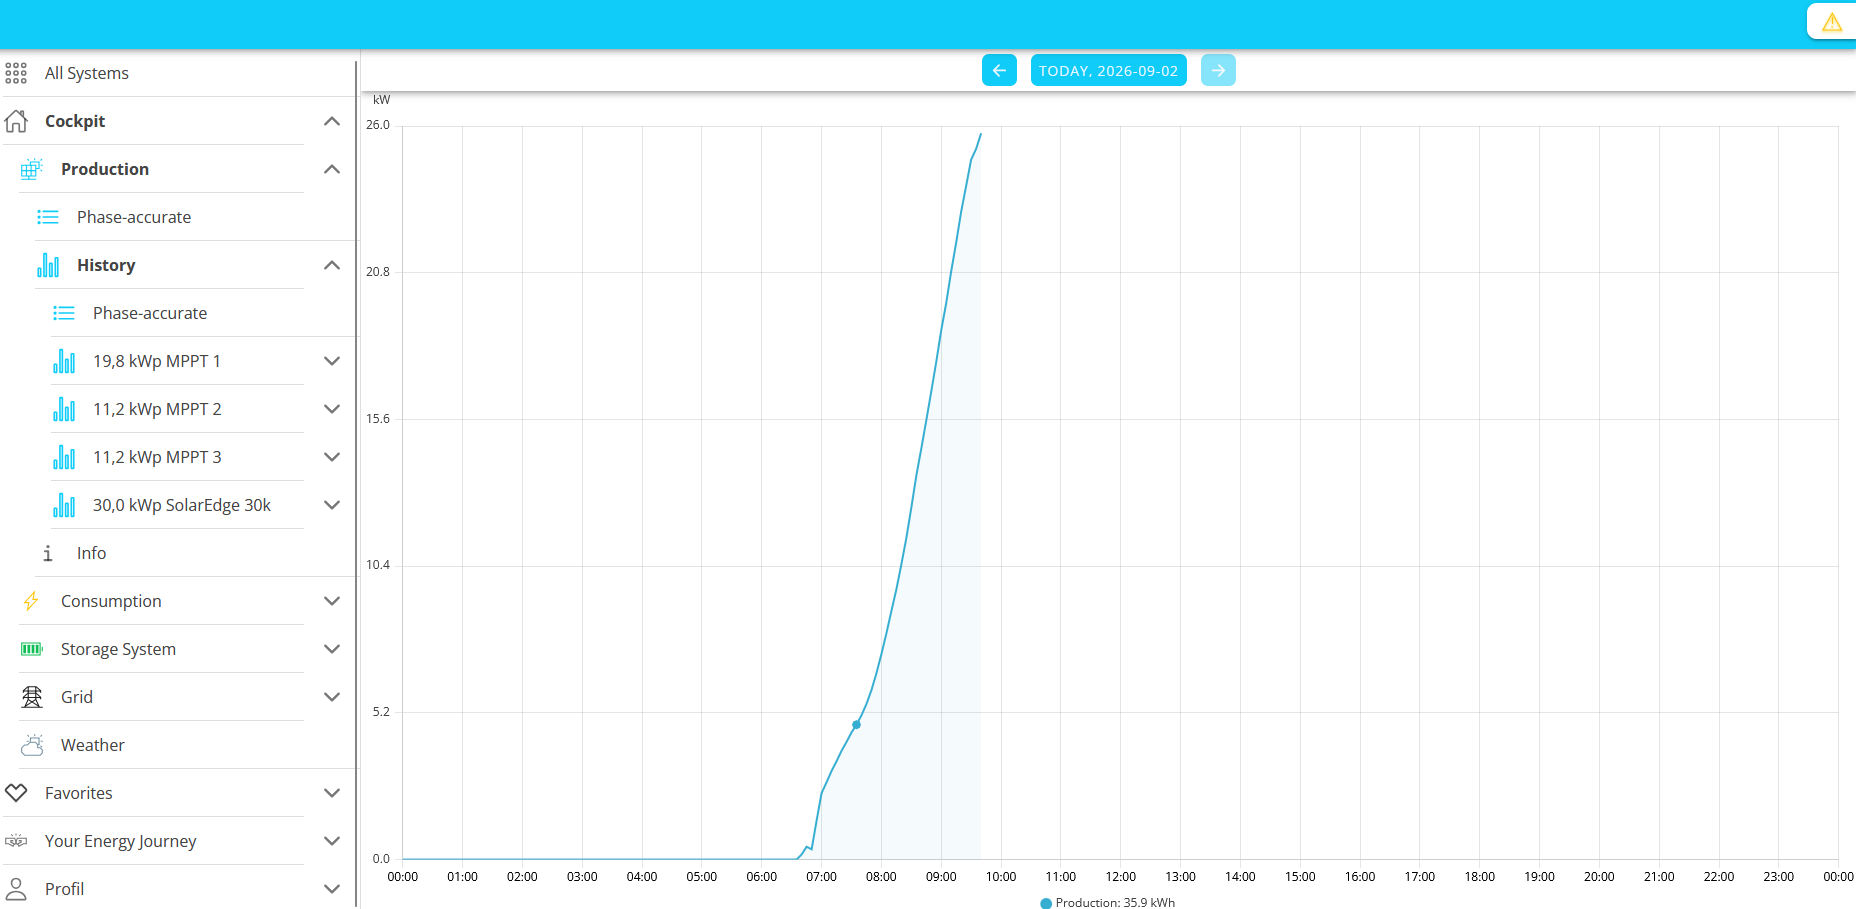
History:
Phase-Accurate History:
⬤ Total, ⬤ Phase L1, ⬤ Phase L2, ⬤ Phase L3
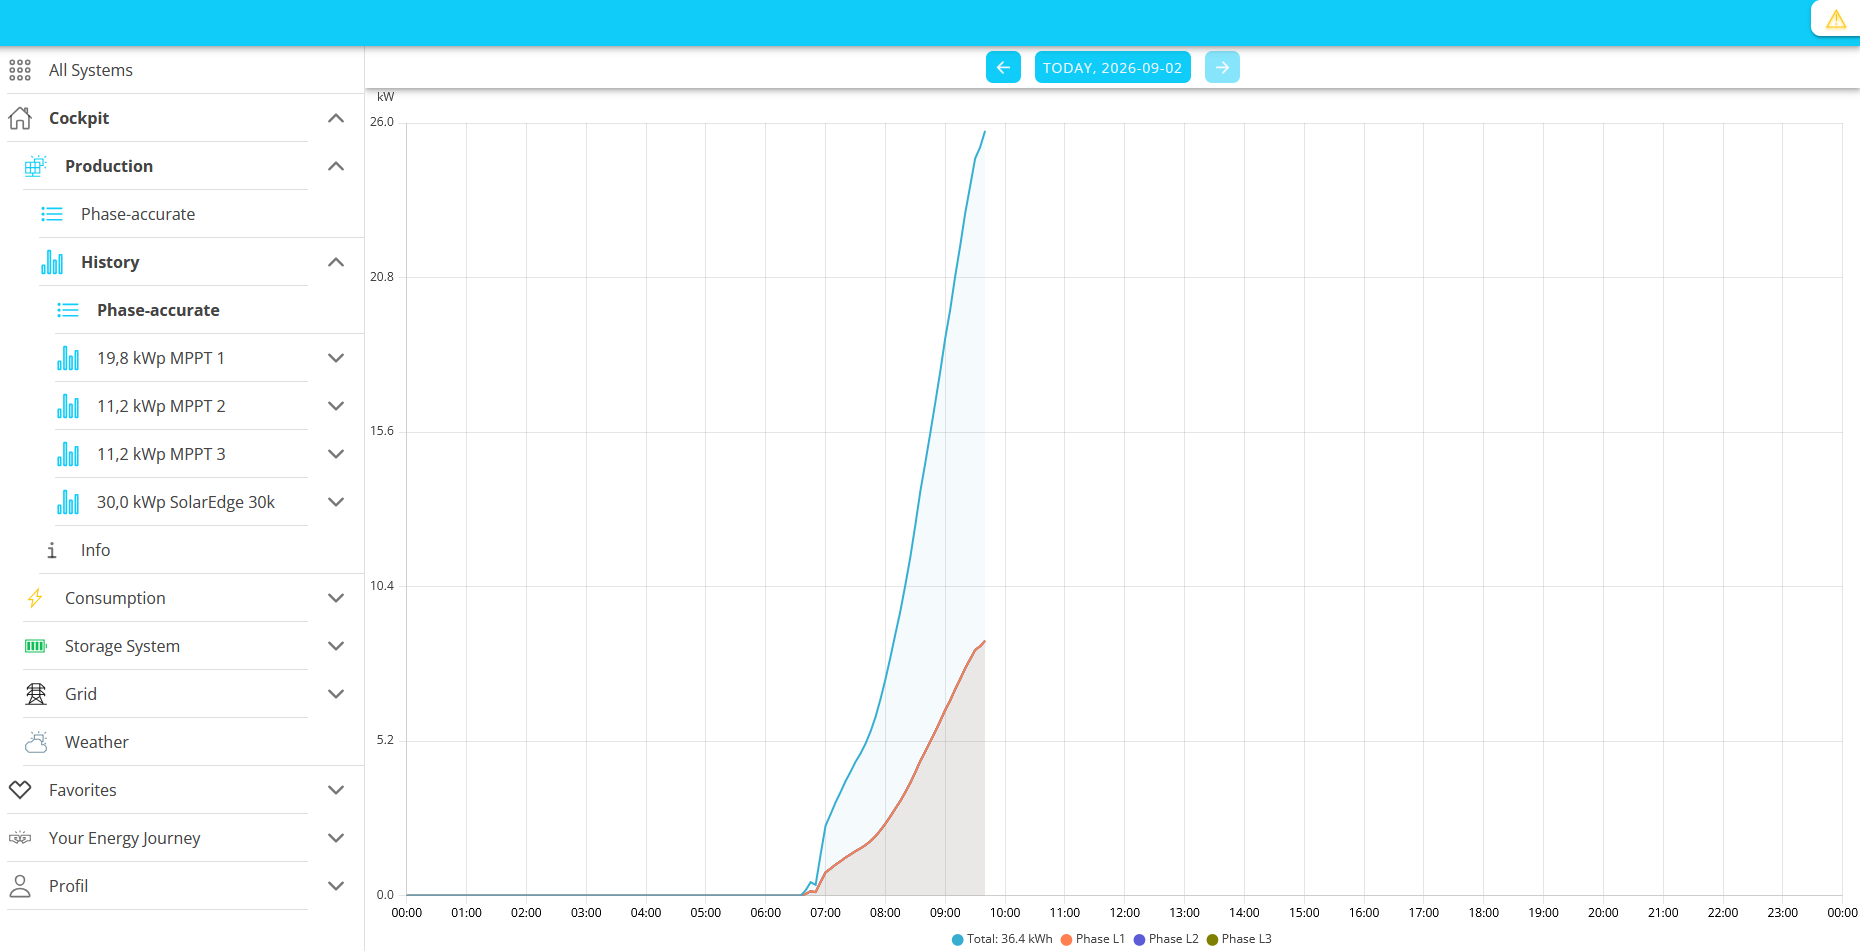
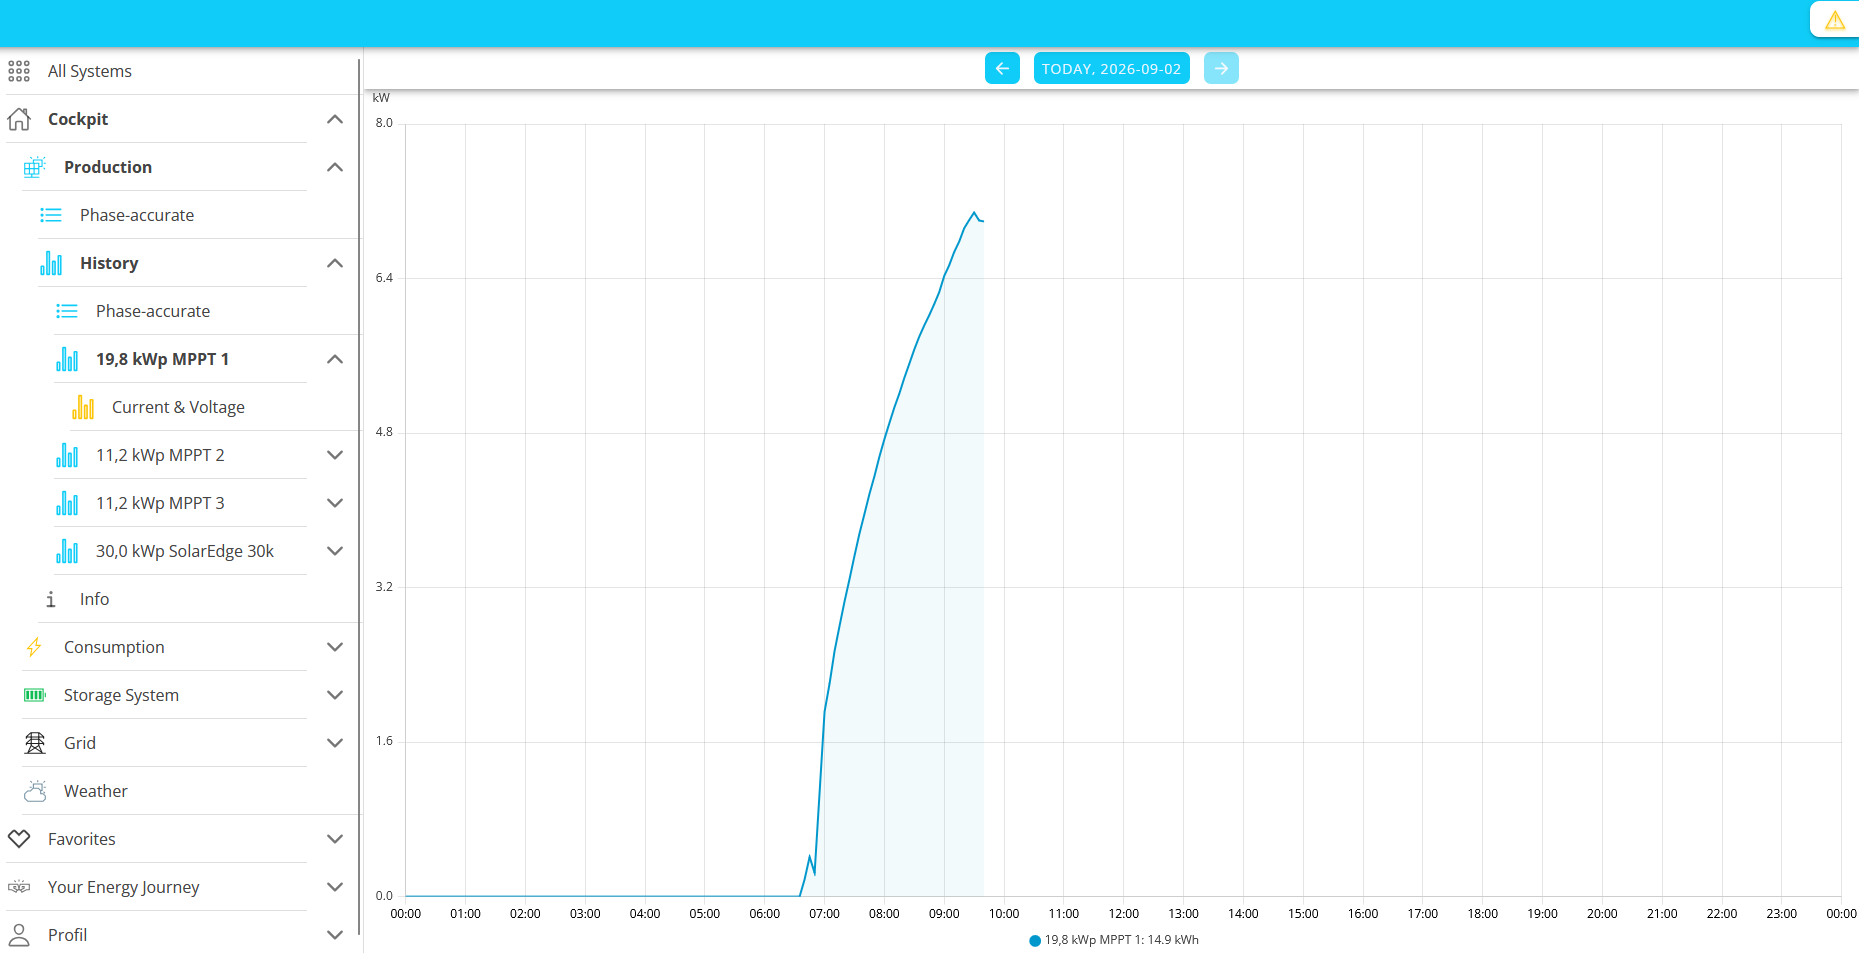
History of the individual MPP trackers:
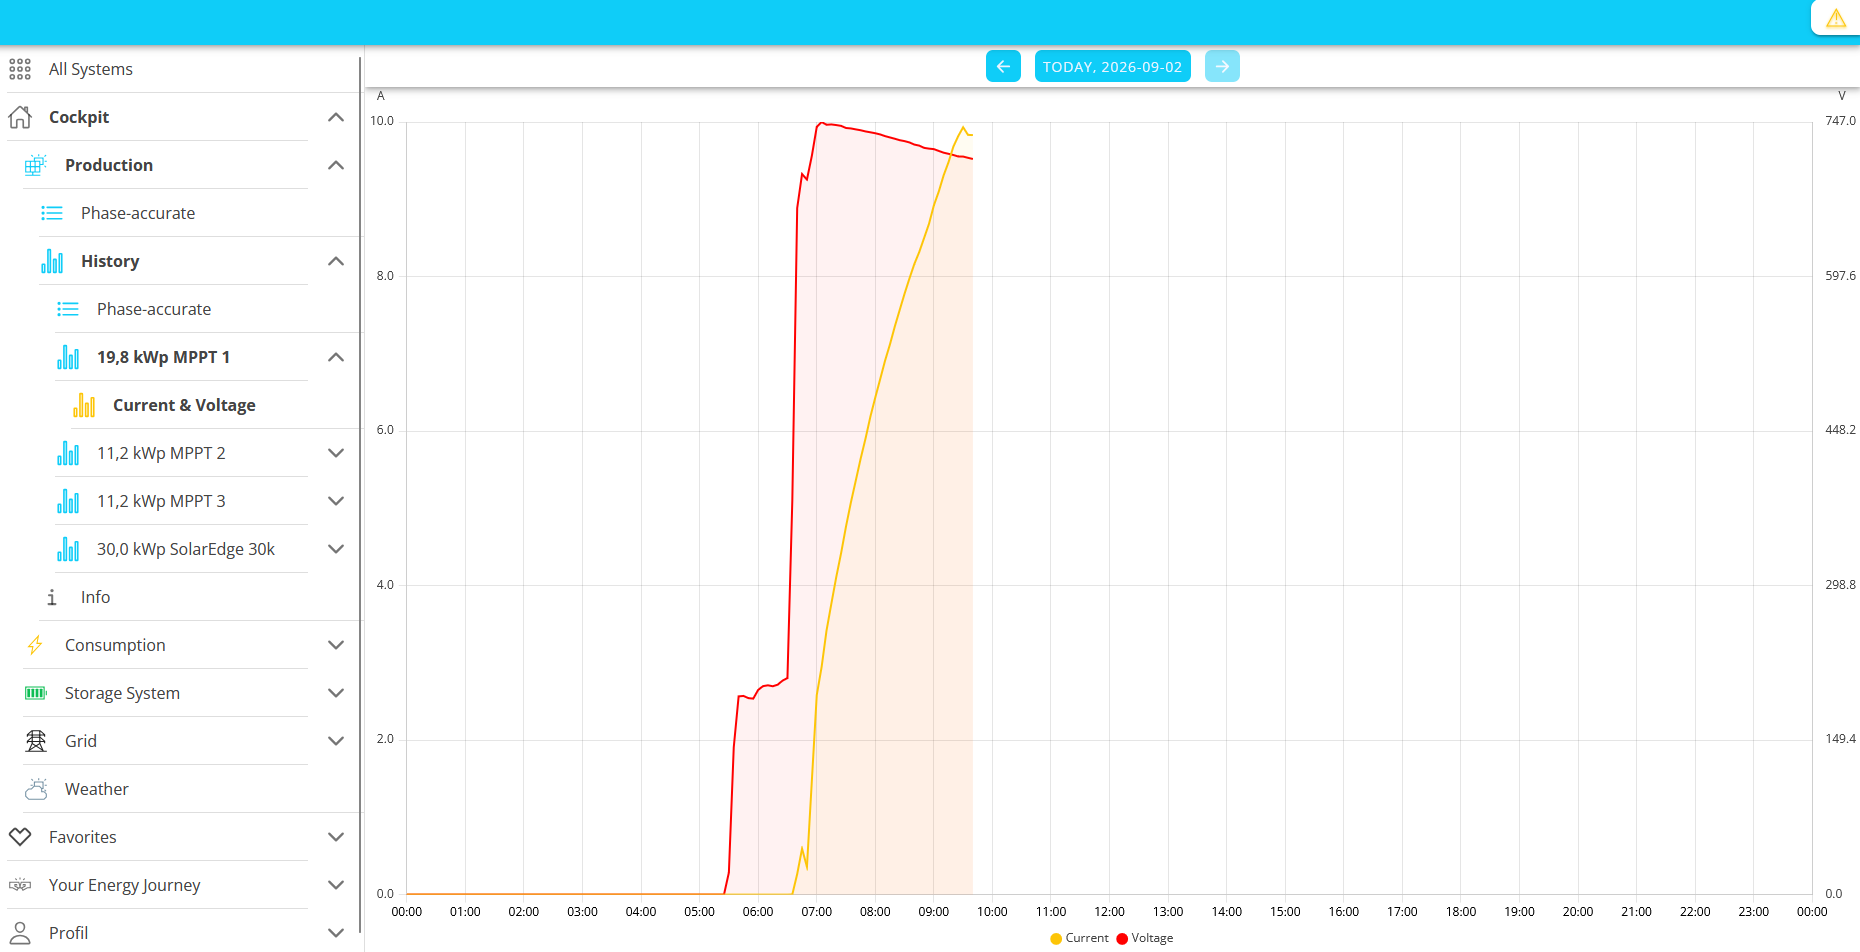
Current & Voltage of the Individual MPP Trackers:
⬤ Current, ⬤ Voltage
2. Consumption
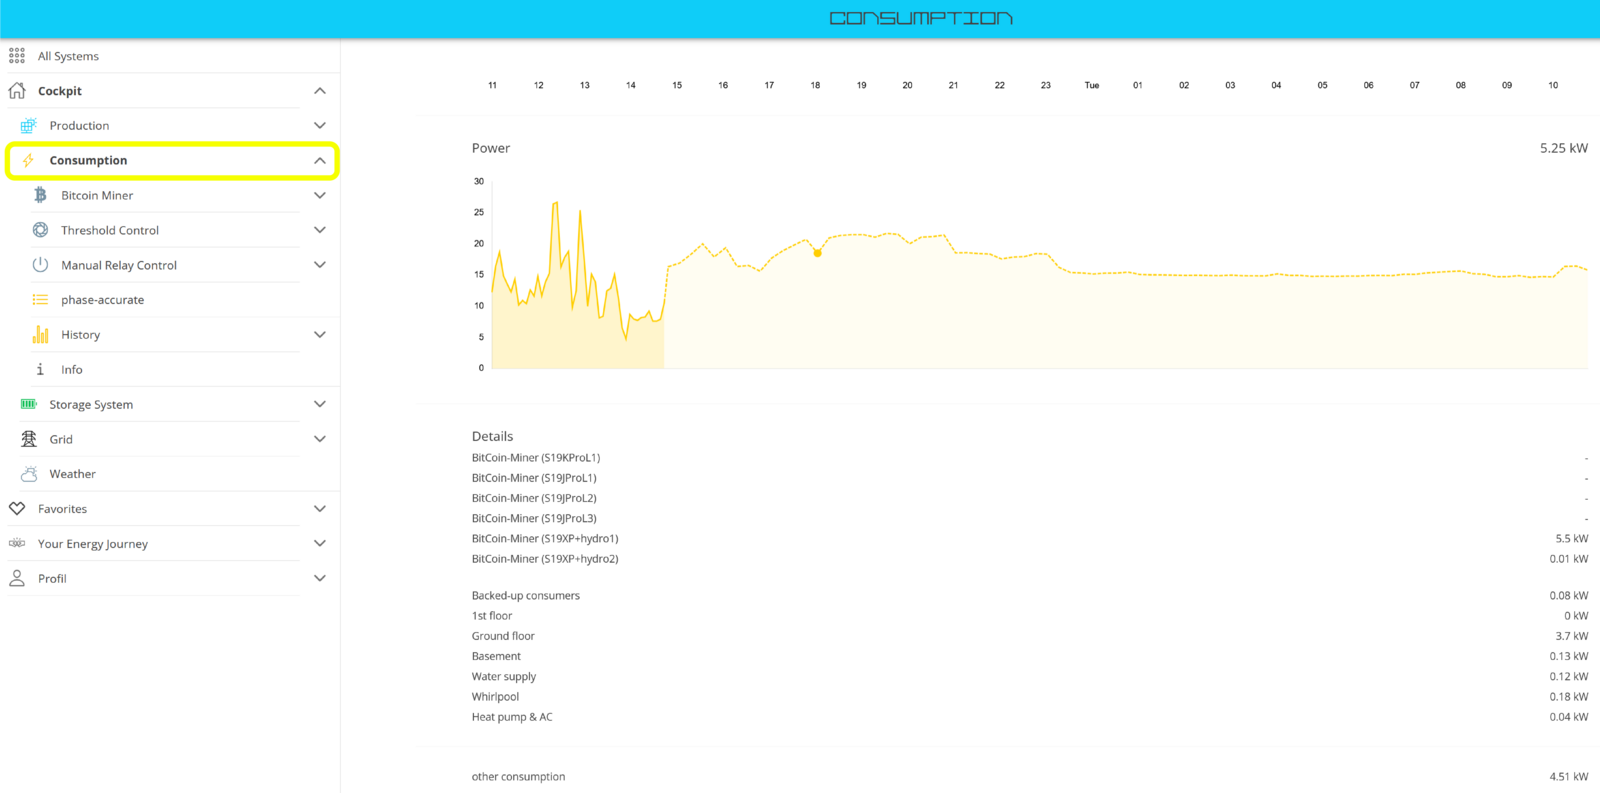
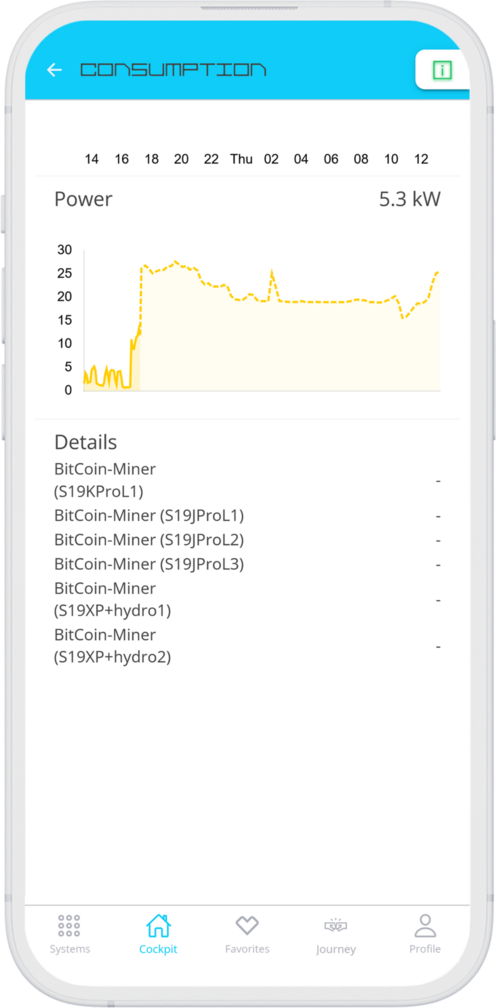
Der Hauptmenüpunkt Verbrauch zeigt in seinem Hauptfenster die aktuelle Leistung des ⬤ Verbrauchs an. Sie erhalten außerdem eine Verbrauchsprognose für den aktuellen und den kommenden Tag in kWh angezeigt, sowie im unteren Bereich Details über einzelne eingebundene Verbraucher.
The consumption forecast, shown as a dashed line in the graph, is one of the features of the new app design.
Other submenu items include:
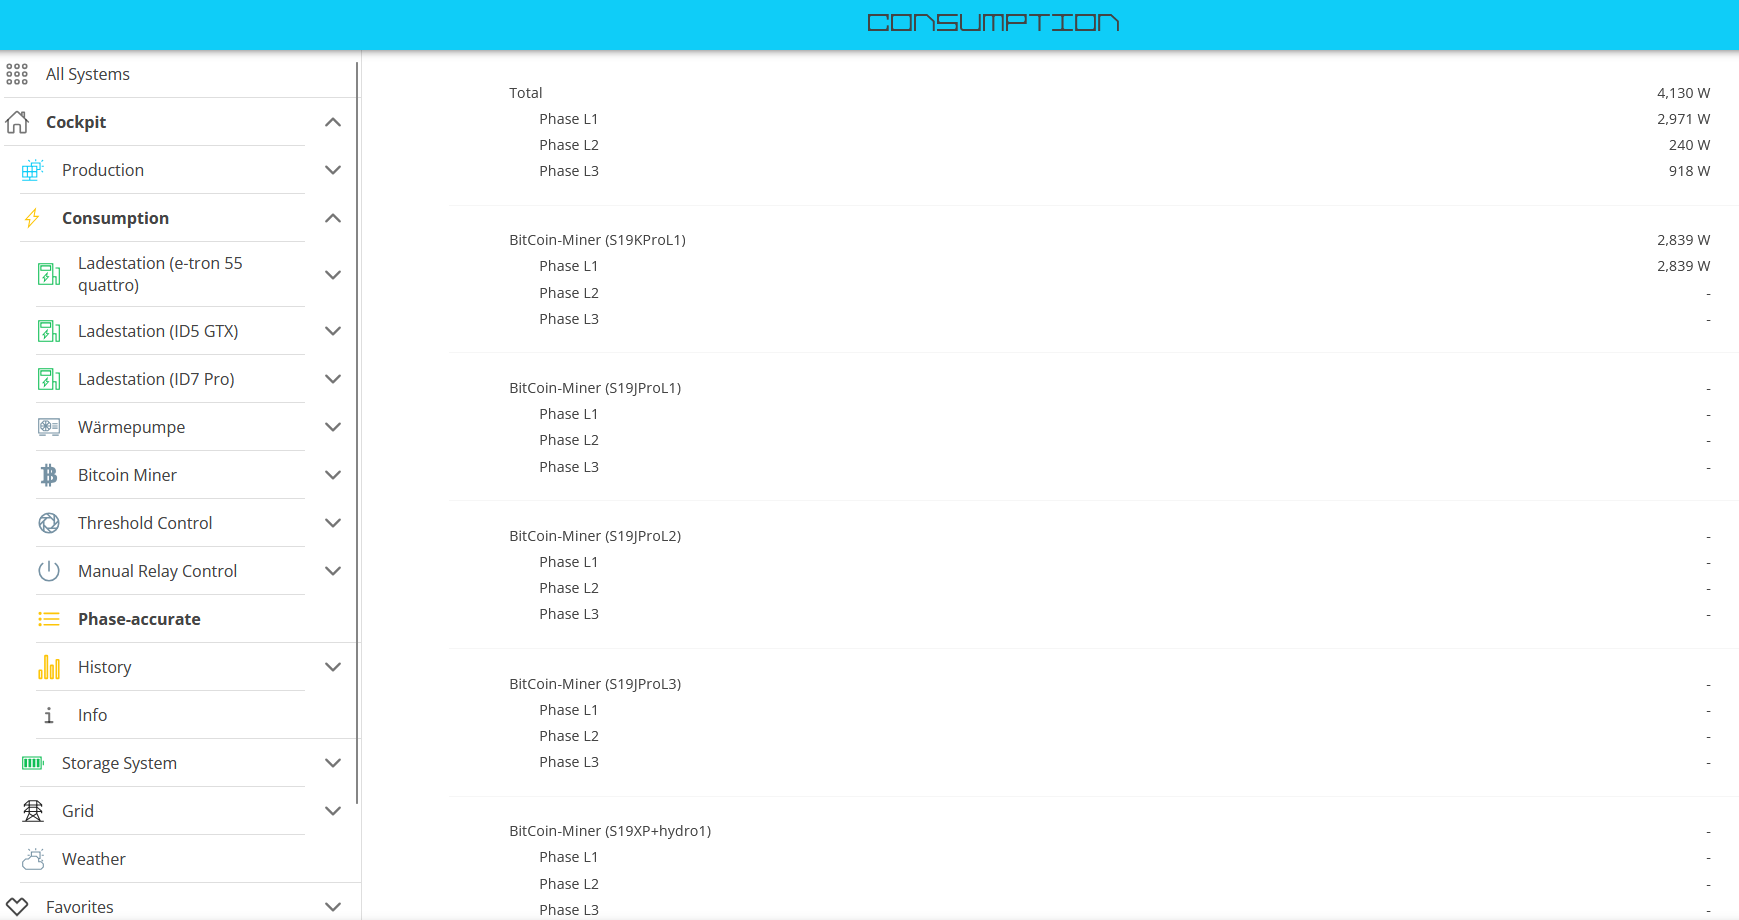
Phase-accurate:
History:
All data for the connected consumer loads is displayed here.
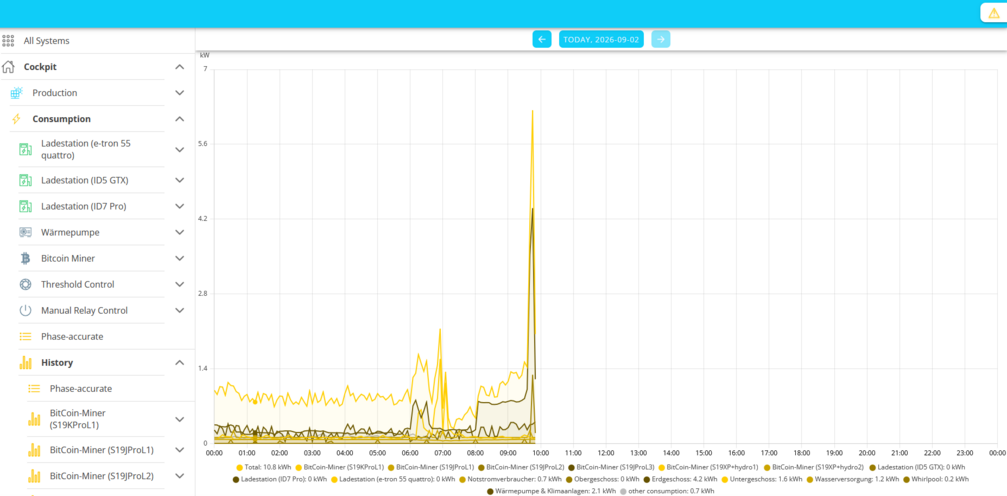
If desired, these can be shown or hidden individually by clicking on the corresponding graph descriptions in the legend.
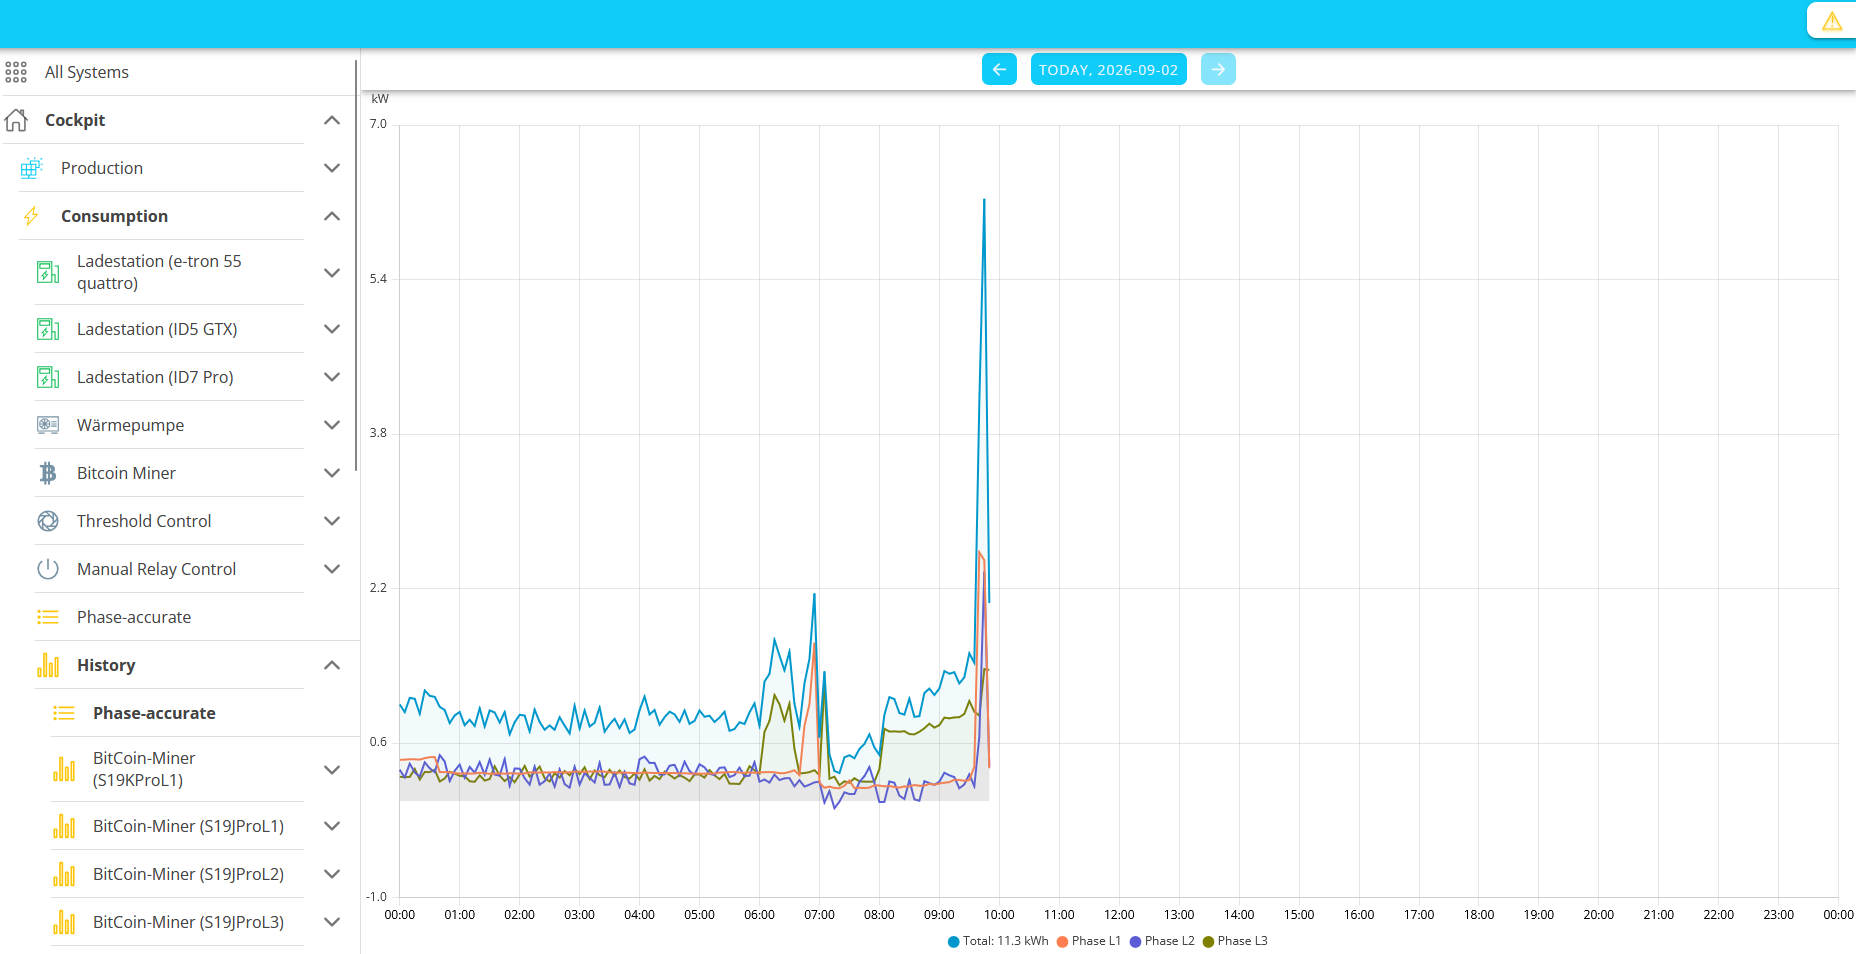
Phase-Accurate History:
⬤ Total, ⬤ Phase L1, ⬤ Phase L2, ⬤ Phase L3
3. Storage System
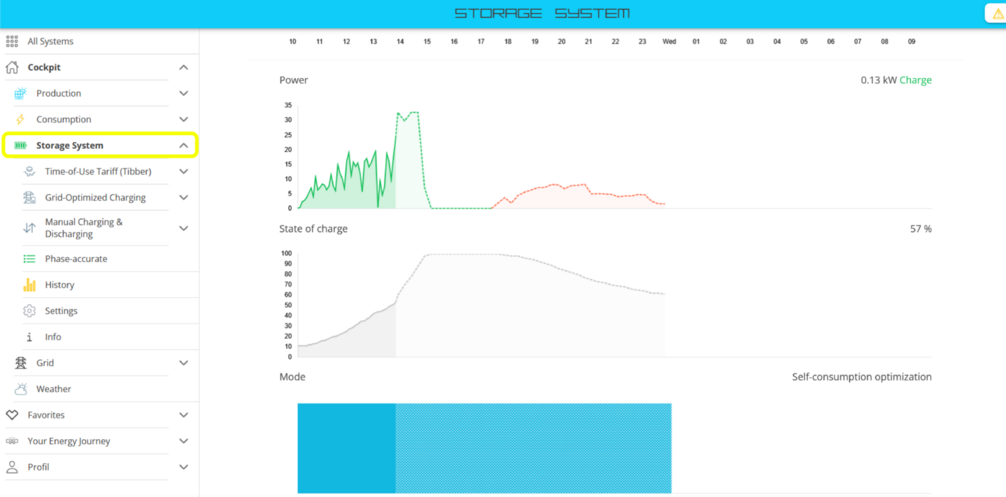
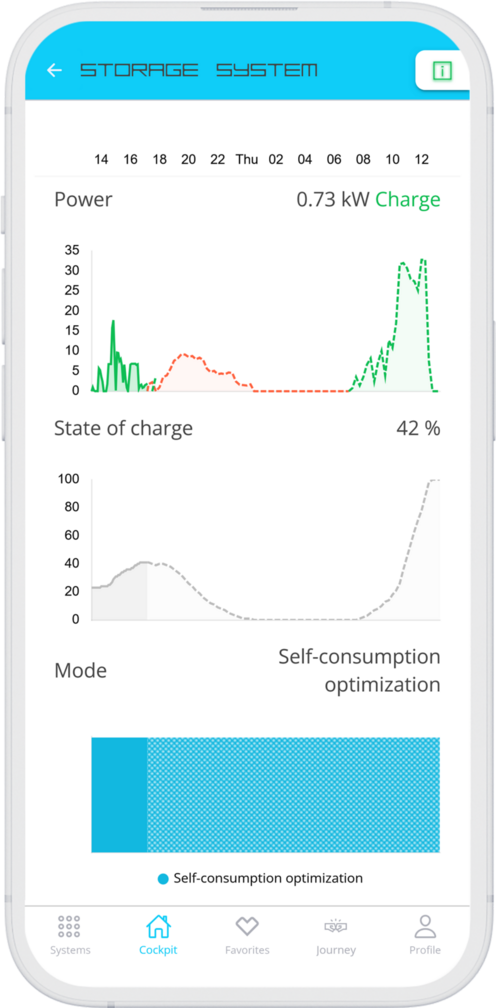
The main window of the Storage System menu item displays the current power and state of charge (SoC) of the battery system.
⬤ Charging, ⬤ Discharging, ⬤ State of Charge
The dashed graphs on this page each show forecast values.
The forecast values displayed in this way help you better estimate future trends in storage capacity and state of charge.
The forecast values are calculated as accurately as possible, taking into account any scheduled times as well.
| The sudden activation of a consumer load can affect the forecast values in the short term. |
Directly below the main menu item Storage System, you will find the available operating modes for the battery system; in this case:
-
Time-of-Use Tariff (with Tibber as the provider)
-
Grid-Optimized Charging
-
Manual Charging & Discharging
Possible operating modes include Static or Time-of-Use Tariff, Grid-Optimized Charging, Manual Charging & Discharging, and Modbus/TCP Write Access. These are explained in the corresponding Symphon-E App manual.
|
Example — Time-of-Use Tariff: How is the operating mode determined? An artificial intelligence system links the available forecasts with dynamic electricity prices and determines an optimized energy plan. This plan defines the appropriate operating mode for every quarter-hour of the available time period. |
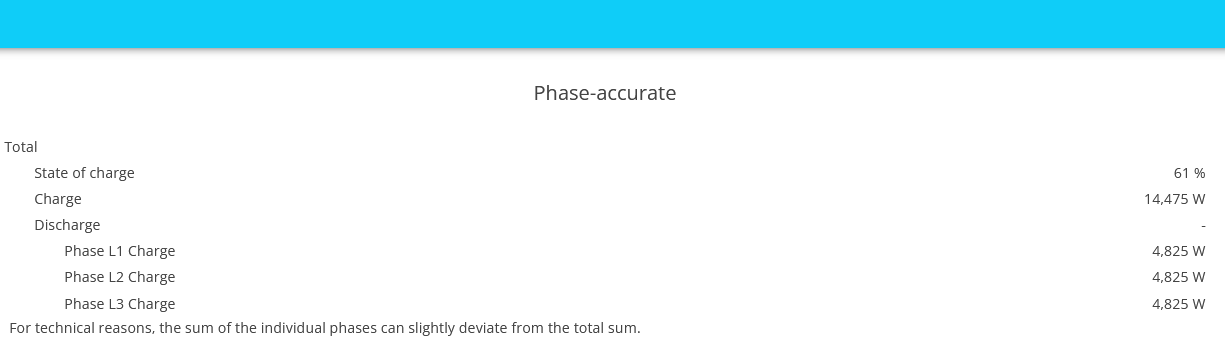
The system also provides a phase-accurate view:
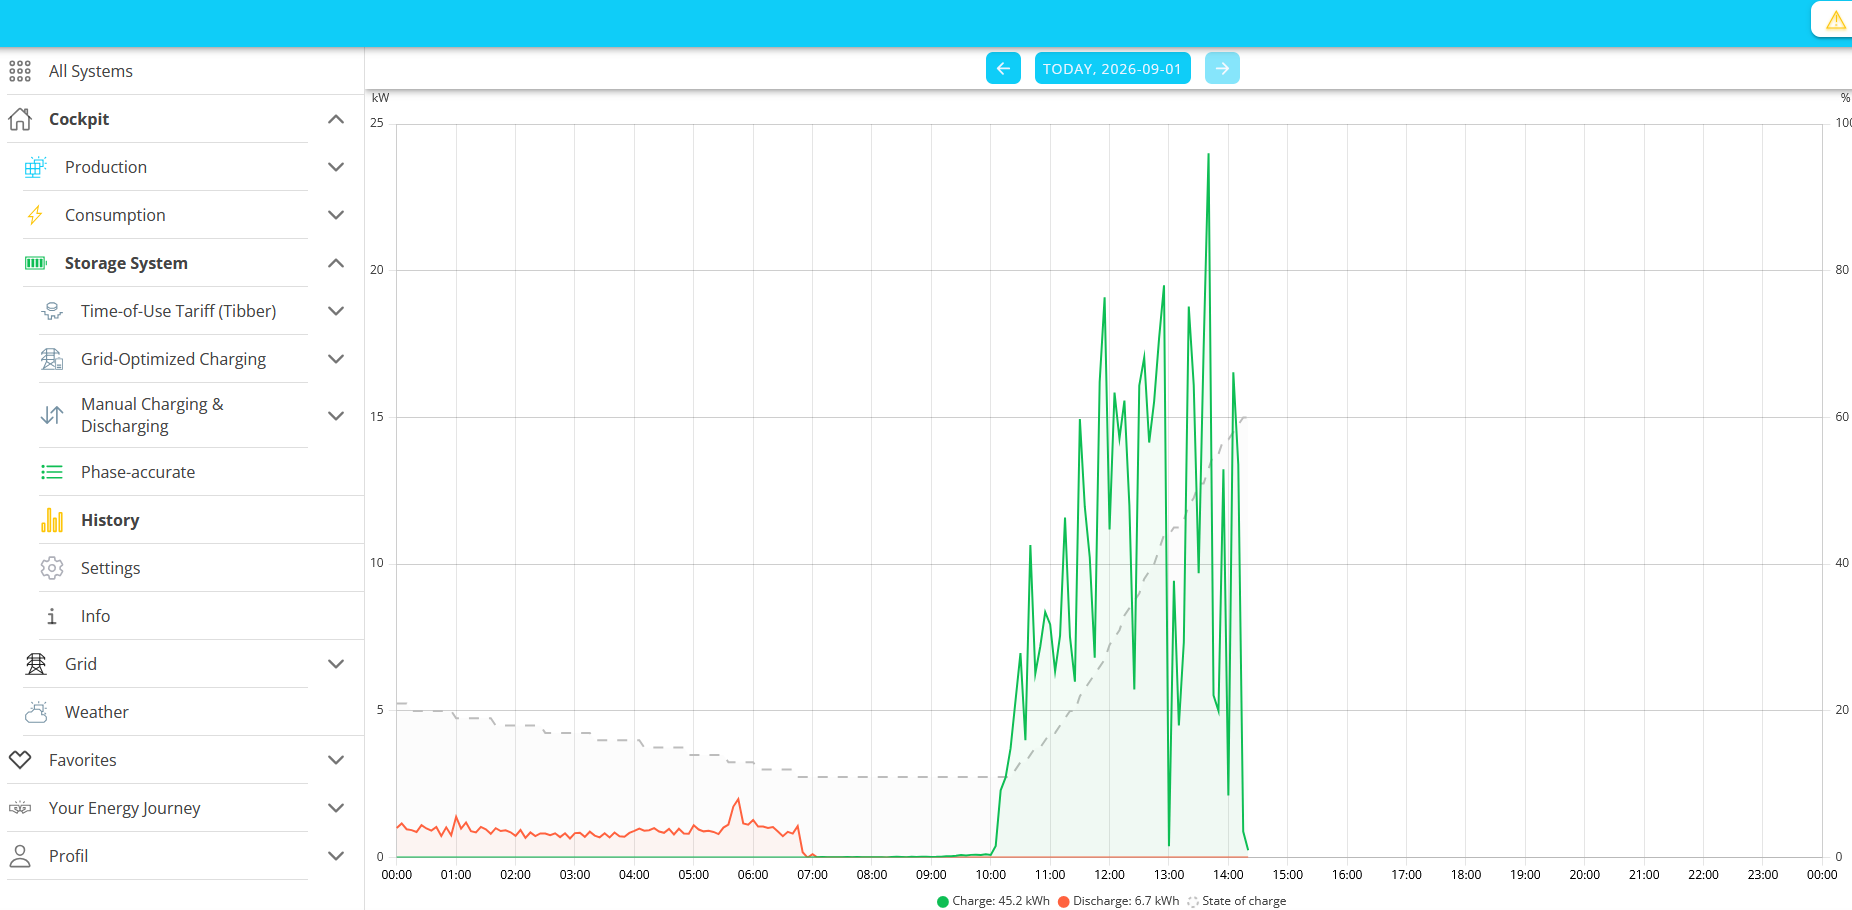
A History:
⬤ Charging, ⬤ Discharging, ⬤ State of Charge (SoC, dashed line)
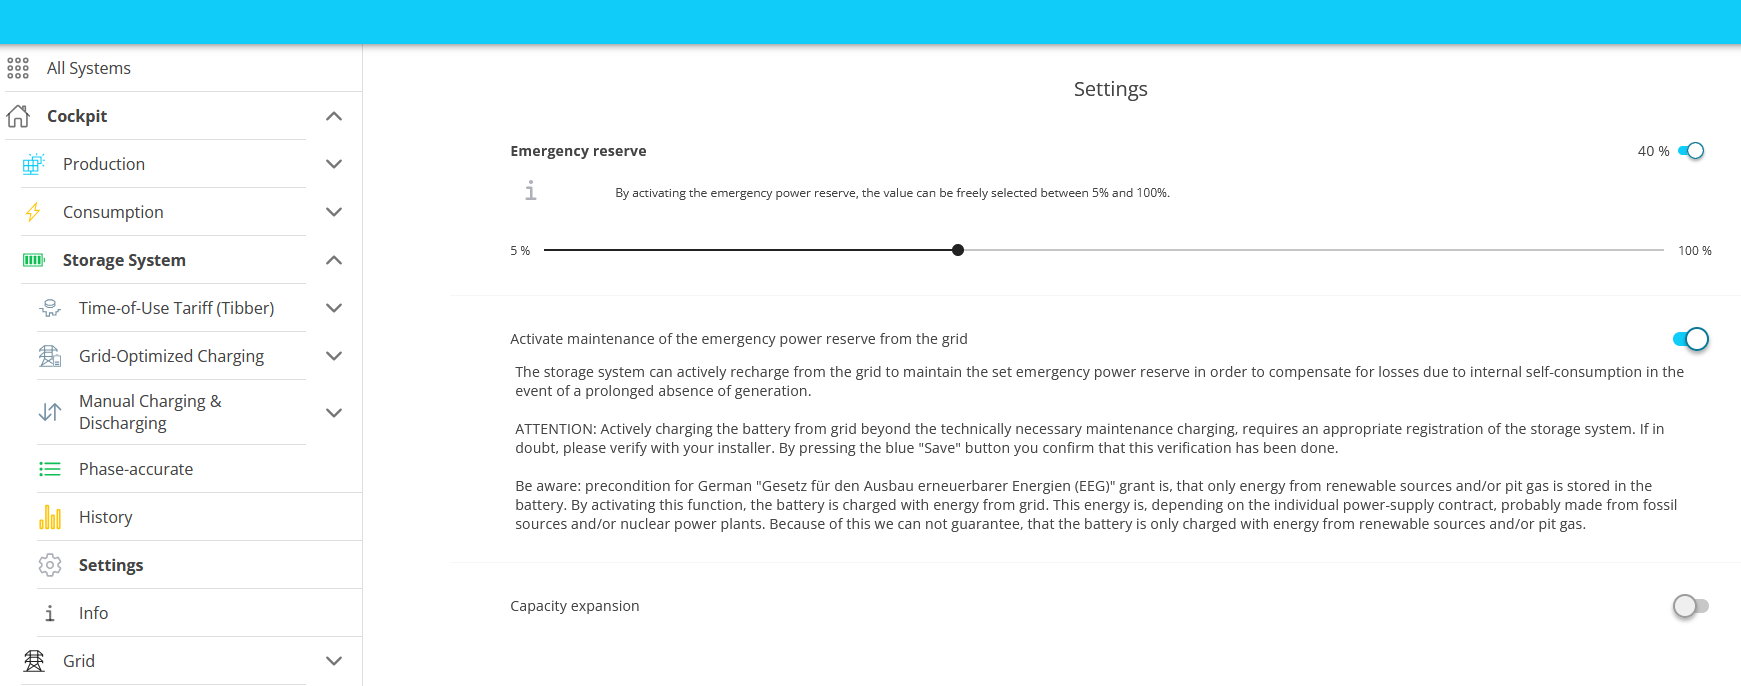
As well as a "Settings" page where the emergency power reserve is configured.
| Here, you prepare the system for an upcoming capacity expansion with additional battery modules, for which the battery energy storage system must be brought to 30 % SoC. |
Expansion of the energy storage system
| These settings are available only for the INSTALLER access level. |
After clicking the slider labeled Capacity Expansion, you can schedule the capacity expansion for a specific day and time, …

... or to start the necessary preparations right away:

4. Grid
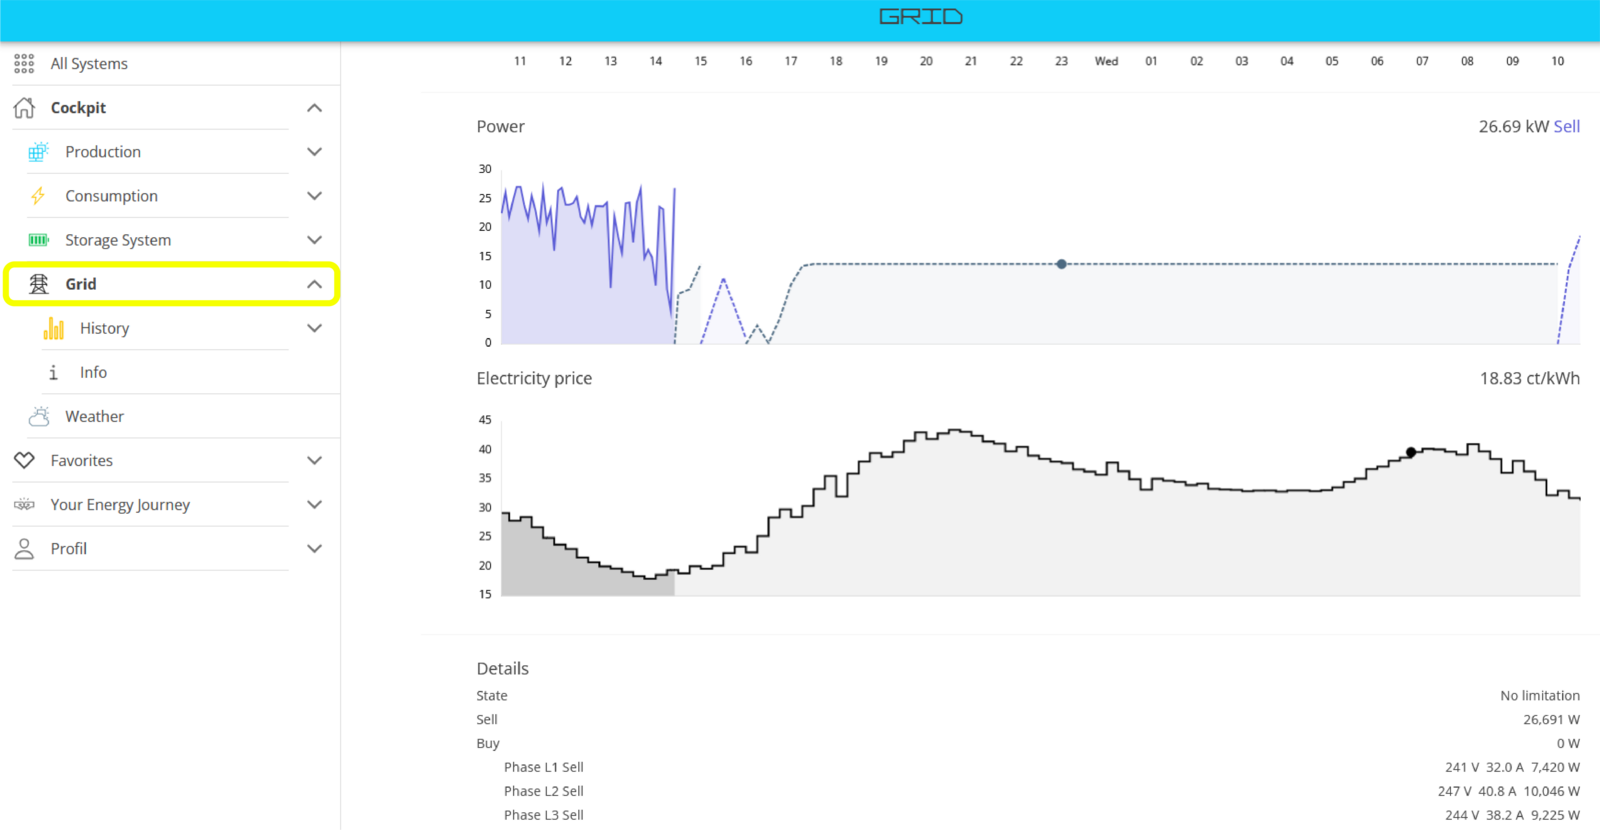
The main window of the Grid menu item displays the current power fed into the grid ⬤ as well as the ⬤ grid withdrawal, and in the graph below, the current ⬤ electricity price.
The details at the bottom indicate whether grid feed-in is currently being limited by an external factor, and how much power was fed into each phase.
Another submenu item is History:
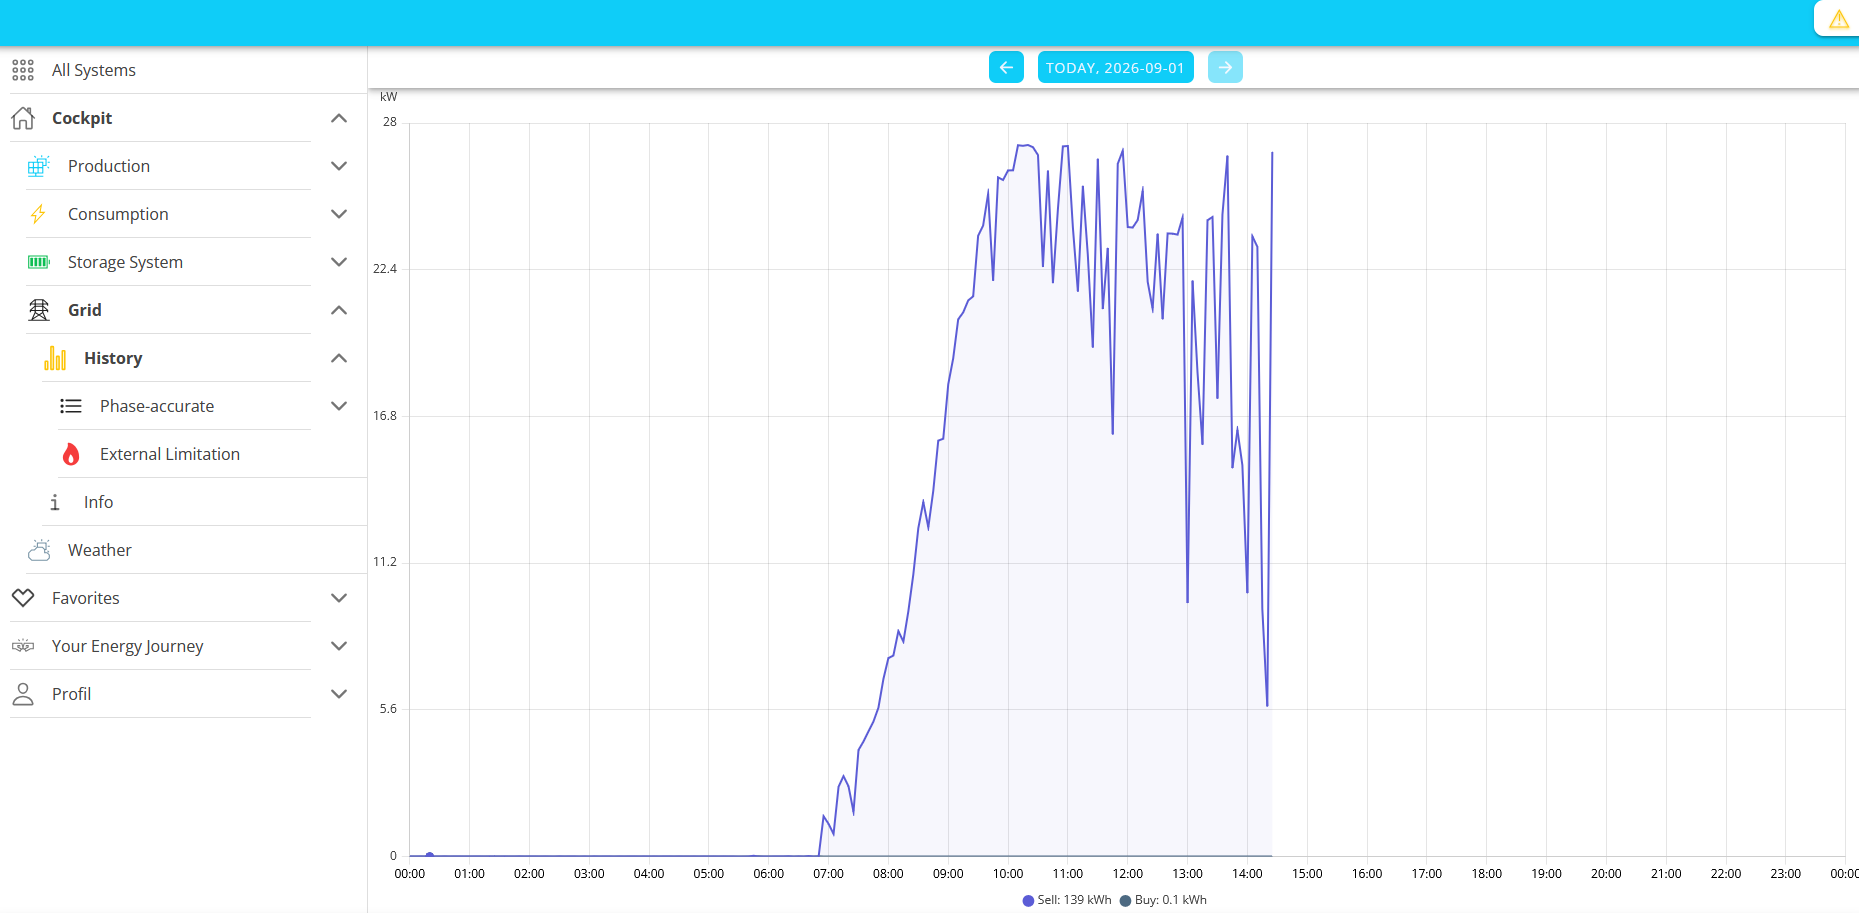
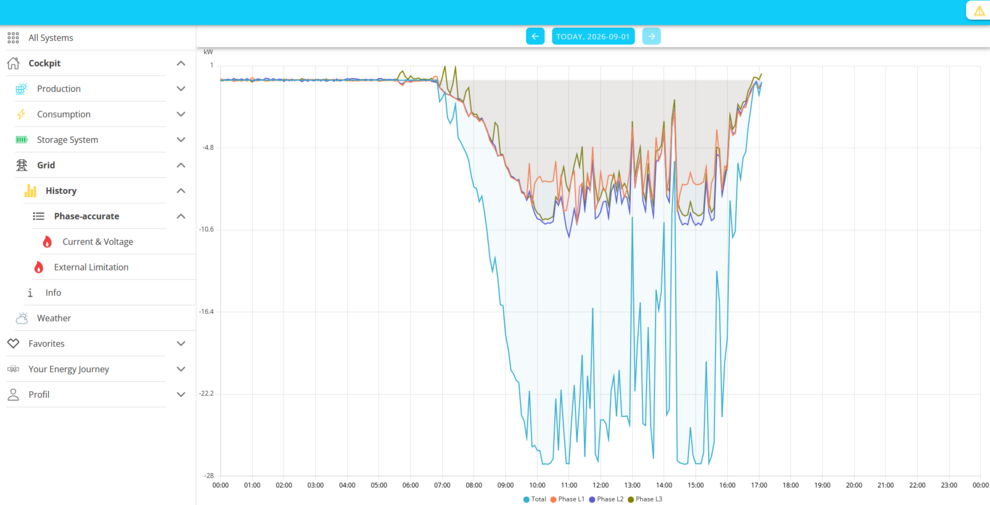
It offers two additional graphical representations: Phase-accuracy and Current & Voltage.
Phase-accurate:
⬤ Total, ⬤ Phase L1, ⬤ Phase L2, ⬤ Phase L3
Current & Voltage:
⬤ Current L1, ⬤ Current L2, ⬤ Current L3, ⬤ Voltage L1, ⬤ Voltage L2, ⬤ Voltage L3
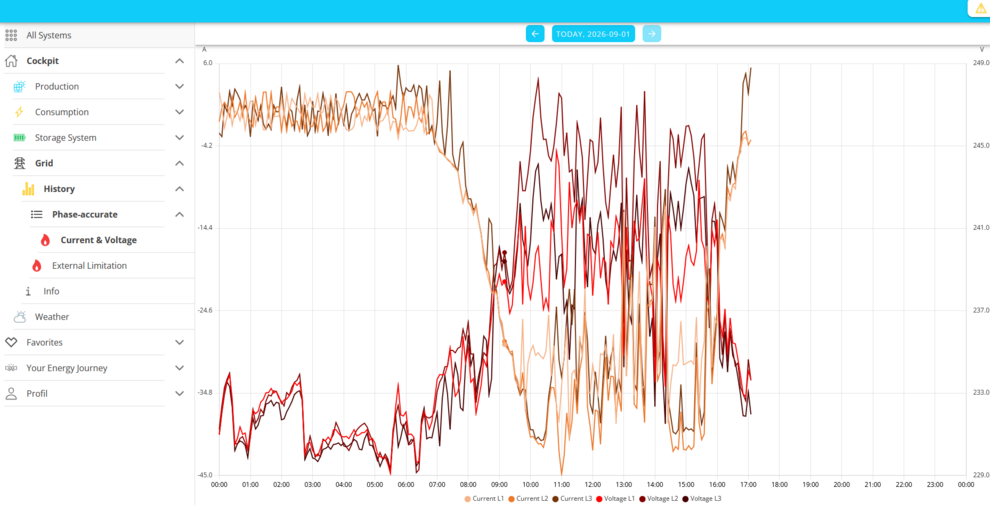
If desired, you can show or hide individual phases by clicking on the corresponding entries in the legend.
5. Weather
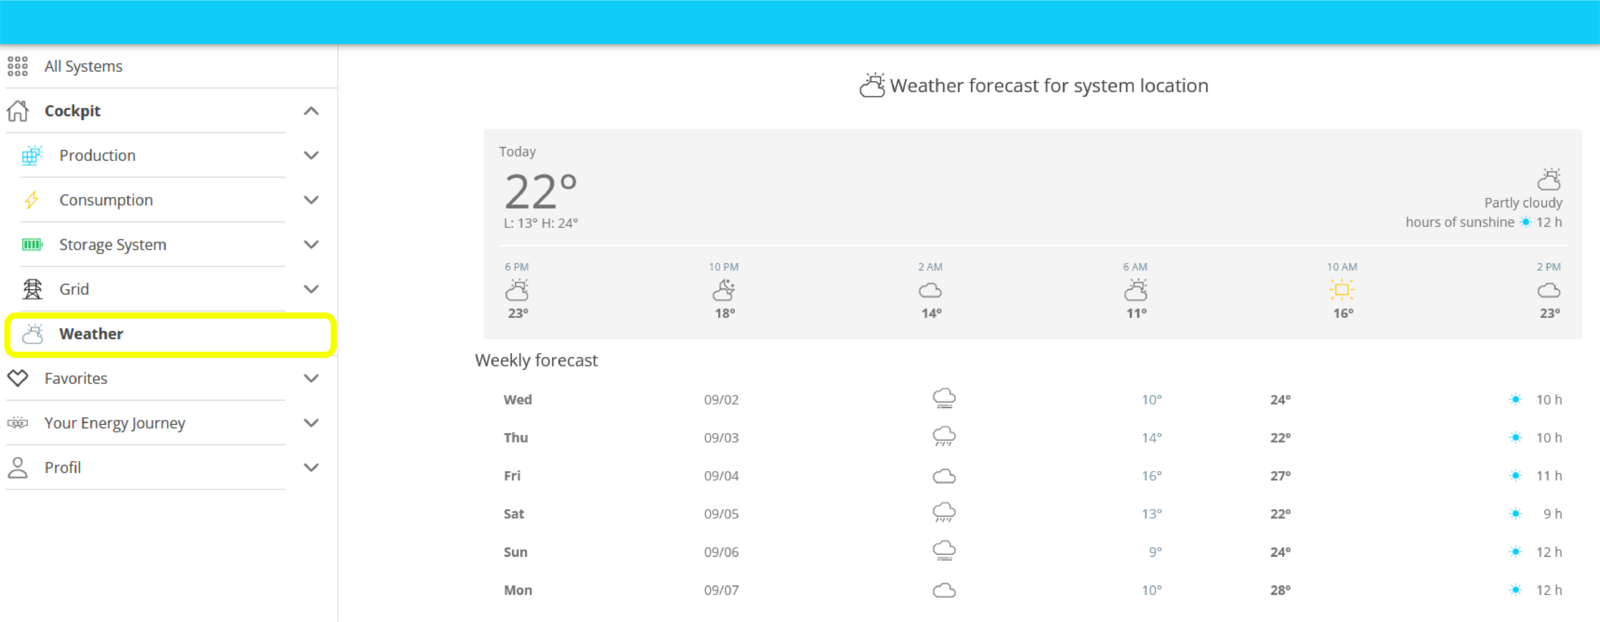
The Weather main menu item displays the weather at the system location in its main window, provided you have installed the Symphon-E App Weather app.
You’ll also receive a weather forecast for today and for the coming days.
6. FENA

|
FENA stands for Heckert Solar Assistant and is a smart assistant that helps you optimize your energy management and provides you with helpful information. Currently, FENA provides information and forecasts, e. g. Emergency power active: Your Heckert Solar system is currently supplying power to your consumer loads from your storage. Additional features will be added at a later date. |
Favorites
Nutzer mit dem Zugriffslevel OWNER haben die Möglichkeit, Menüpunkte als Favoriten festzulegen. Diese werden dann im Hauptmenü unter Favoriten angezeigt.
Hauptpunkte wie Erzeugung, Verbrauch, Netz usw., aber auch eingebundene Komponenten wie eine Ladestation können als Favoriten festgelegt werden. Auch bestimmte Unter-Seiten wie Historie können einzeln favorisiert werden, werden jedoch als "anhängig" von der Hauptseite betrachtet: Wird der Menüpunkt favorisiert, werden die darunterliegenden Menüpunkte ebenfalls favorisiert.
-
By default, Overall History of Your Energy Journey is set as a favorite. The following section explains how to set additional favorites.
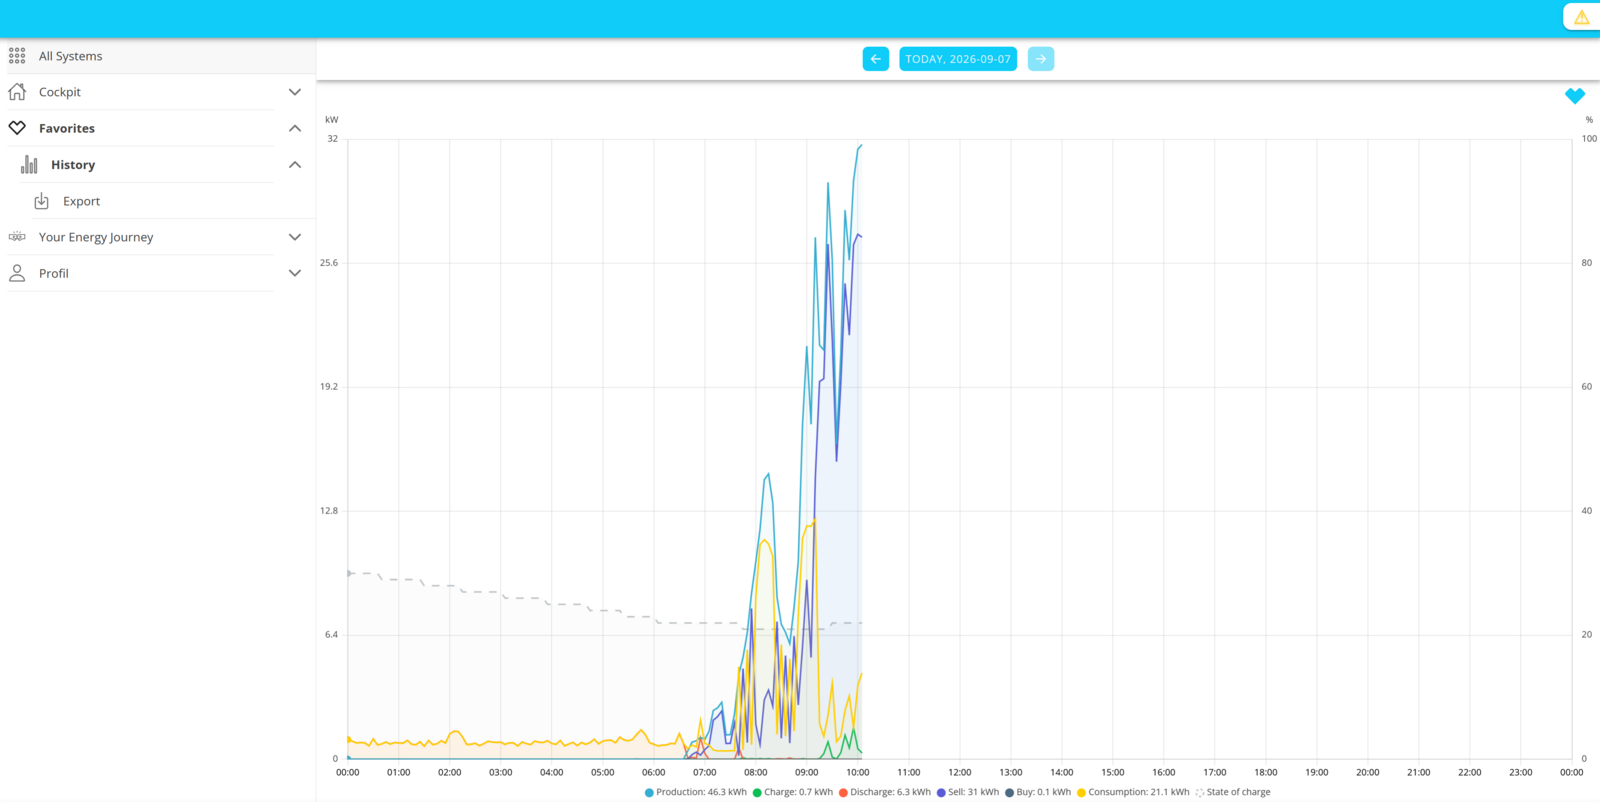
-
Navigate to the desired page in the Heckert Solar app. In this example, go to a KEBA wallbox, which can be found under the main menu item Consumption.
-
Activate the heart icon to add the page to Favorites:
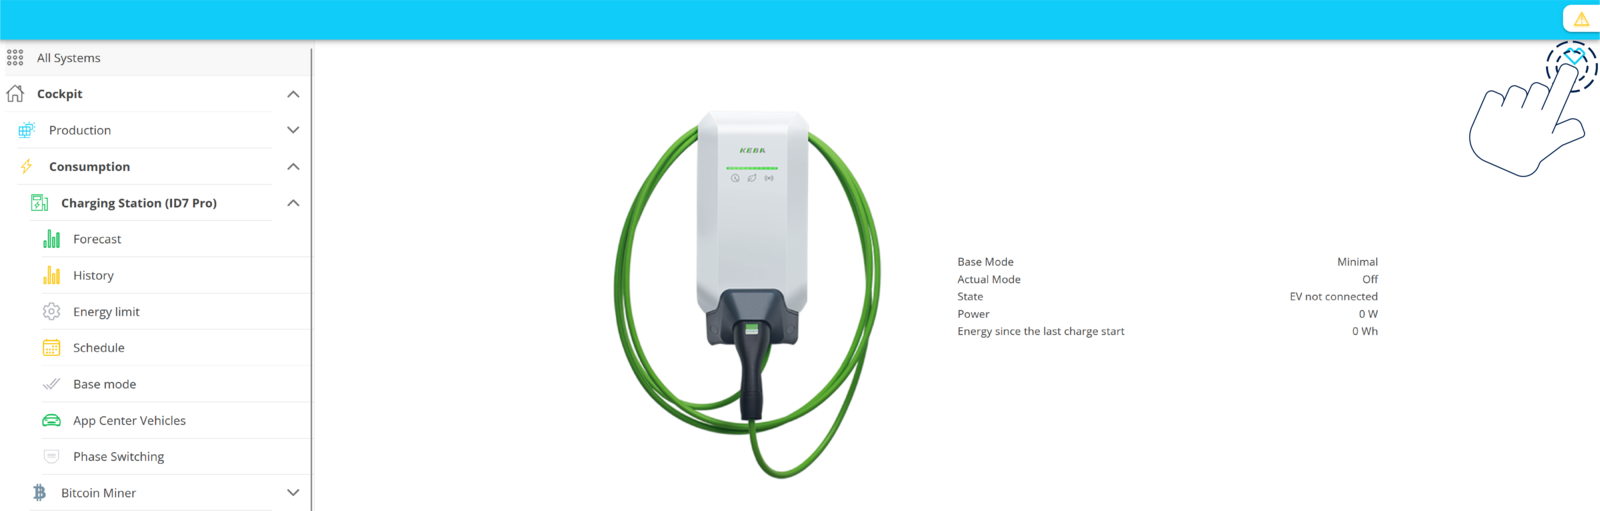
-
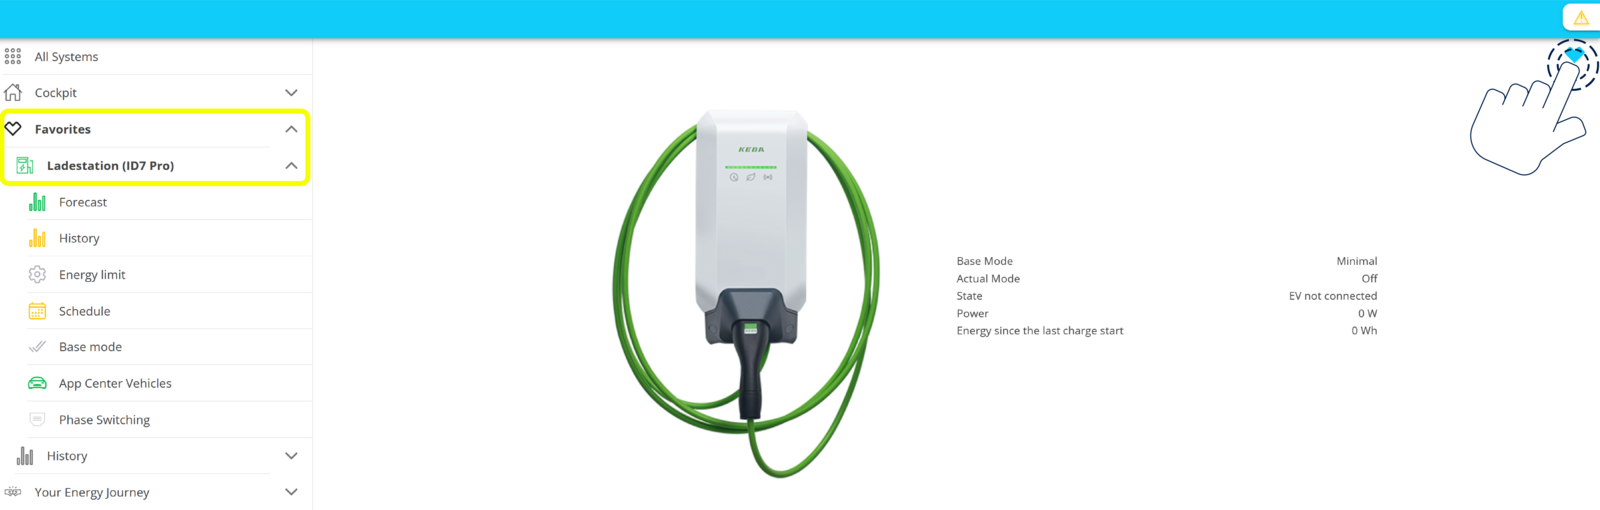
The page now appears in the navigation bar under Favorites.
-
To remove the page from your favorites, activate the heart icon again. The page will then no longer appear in the navigation bar under Favorites.
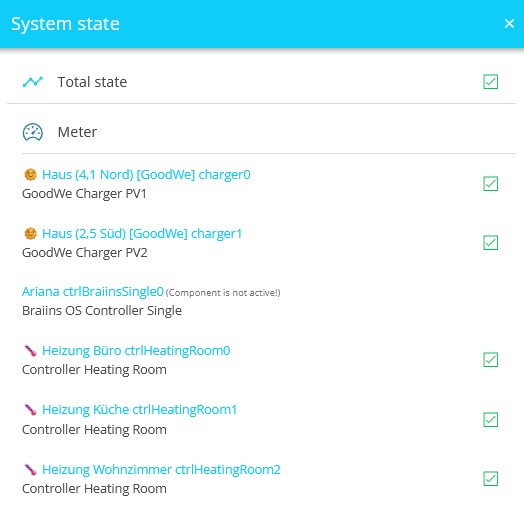
System status
The system status display is located in the upper-right corner of the cockpit. Clicking the takes you to an overview of all system components and their statuses: |

|
EMS Cockpit — Mobile View
| Mobile Ansicht | Erklärung | ||
|---|---|---|---|
|
Cockpit
Unterhalb des Leistungsmonitors sind diese Unterseiten auch noch einmal textuell aufgelistet. Am unteren Bildschirmrand befinden sich die Hauptnavigations-Icons, die sog. Fixed-Bottom Navigation, die den schnellen Zugriff auf die verschiedenen Bereiche der App ermöglichen und dem Seitenmenü der Web-Version entsprechen: Favoriten Journey Profil |
||
|
Erzeugung Die Erzeugungsprognose, als gestrichelte Linie im Graphen dargestellt, wird nach Installation der kostenlosen Symphon-E App Weather sichtbar. Darunter erhalten Sie, durch Antippen weitere Optionen zur Anzeige, z. B. Phasengenau und Historie mit den entsprechenden Detail-Ansichten, sowie Info. |
||
|
Verbrauch Swipen Sie weiter, erhalten Sie ebenfalls die Graphen für den phasengenauen Verbrauch, die Historie, sowie die phasengenaue Historie. |
||
|
Speichersystem ⬤ Beladung Sie erhalten außerdem eine Prognose für die zukünftige Entwicklung (gestrichelte Linien) der Speicherleistung und des Ladezustands. Darunter befindet sich der Graph für den ⬤ Ladezustand des Speichersystems (SoC). Der gestrichelte graue Graph zeigt den Prognosewert für den Ladezustand des Speichersystems (SoC) an. Unter dem SoC-Graphen wird der aktuelle Modus des Speichersystems angezeigt, sowie die anstehenden, zukünftigen Betriebsmodi, in diesem Fall: ⬤ Eigenverbrauchsoptimierung, |
||
|
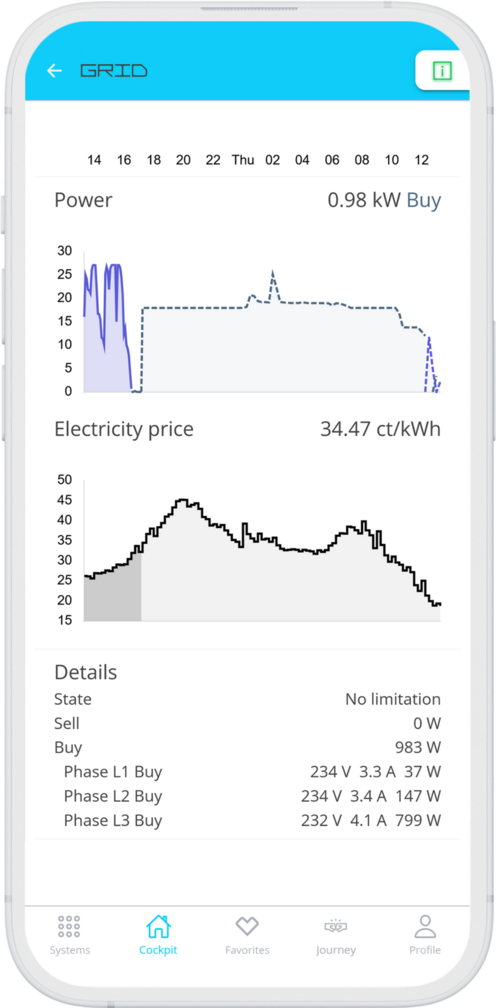
Netz Die Details im unteren Bereich zeigen an, ob aktuell die Einspeisung ins Netz extern limitiert wird, und auf welcher Phase wie viel eingespeist wurde. |
||
|
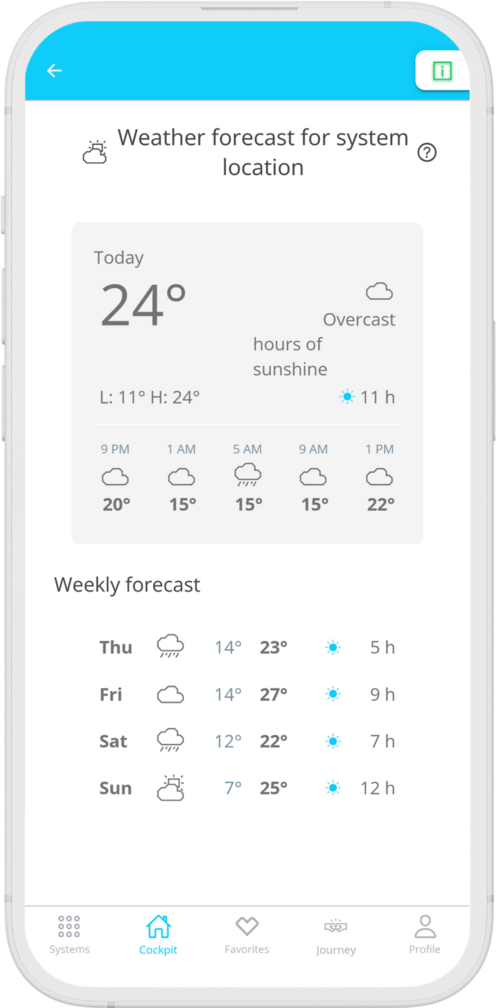
Wetter Sie erhalten auch eine Wetterprognose für den heutigen Tag, sowie für die kommenden Tage. |